Create a Sample Dashboard
In this example we will create a new dashboard that shows humidity and temperature for a device on a Soracom Lagoon 3 Panel using the Demo sample data source provided by Soracom. This data source can be used to verify Lagoon's operation when device data is not yet available.
To follow along with this example, you must have completed the Configuration of Soracom Lagoon.
There is no cost associated with using the Demo sample data. There is also no data export fee for activating Harvest Data's extended data retention option.
Create a New Dashboard and Panel
-
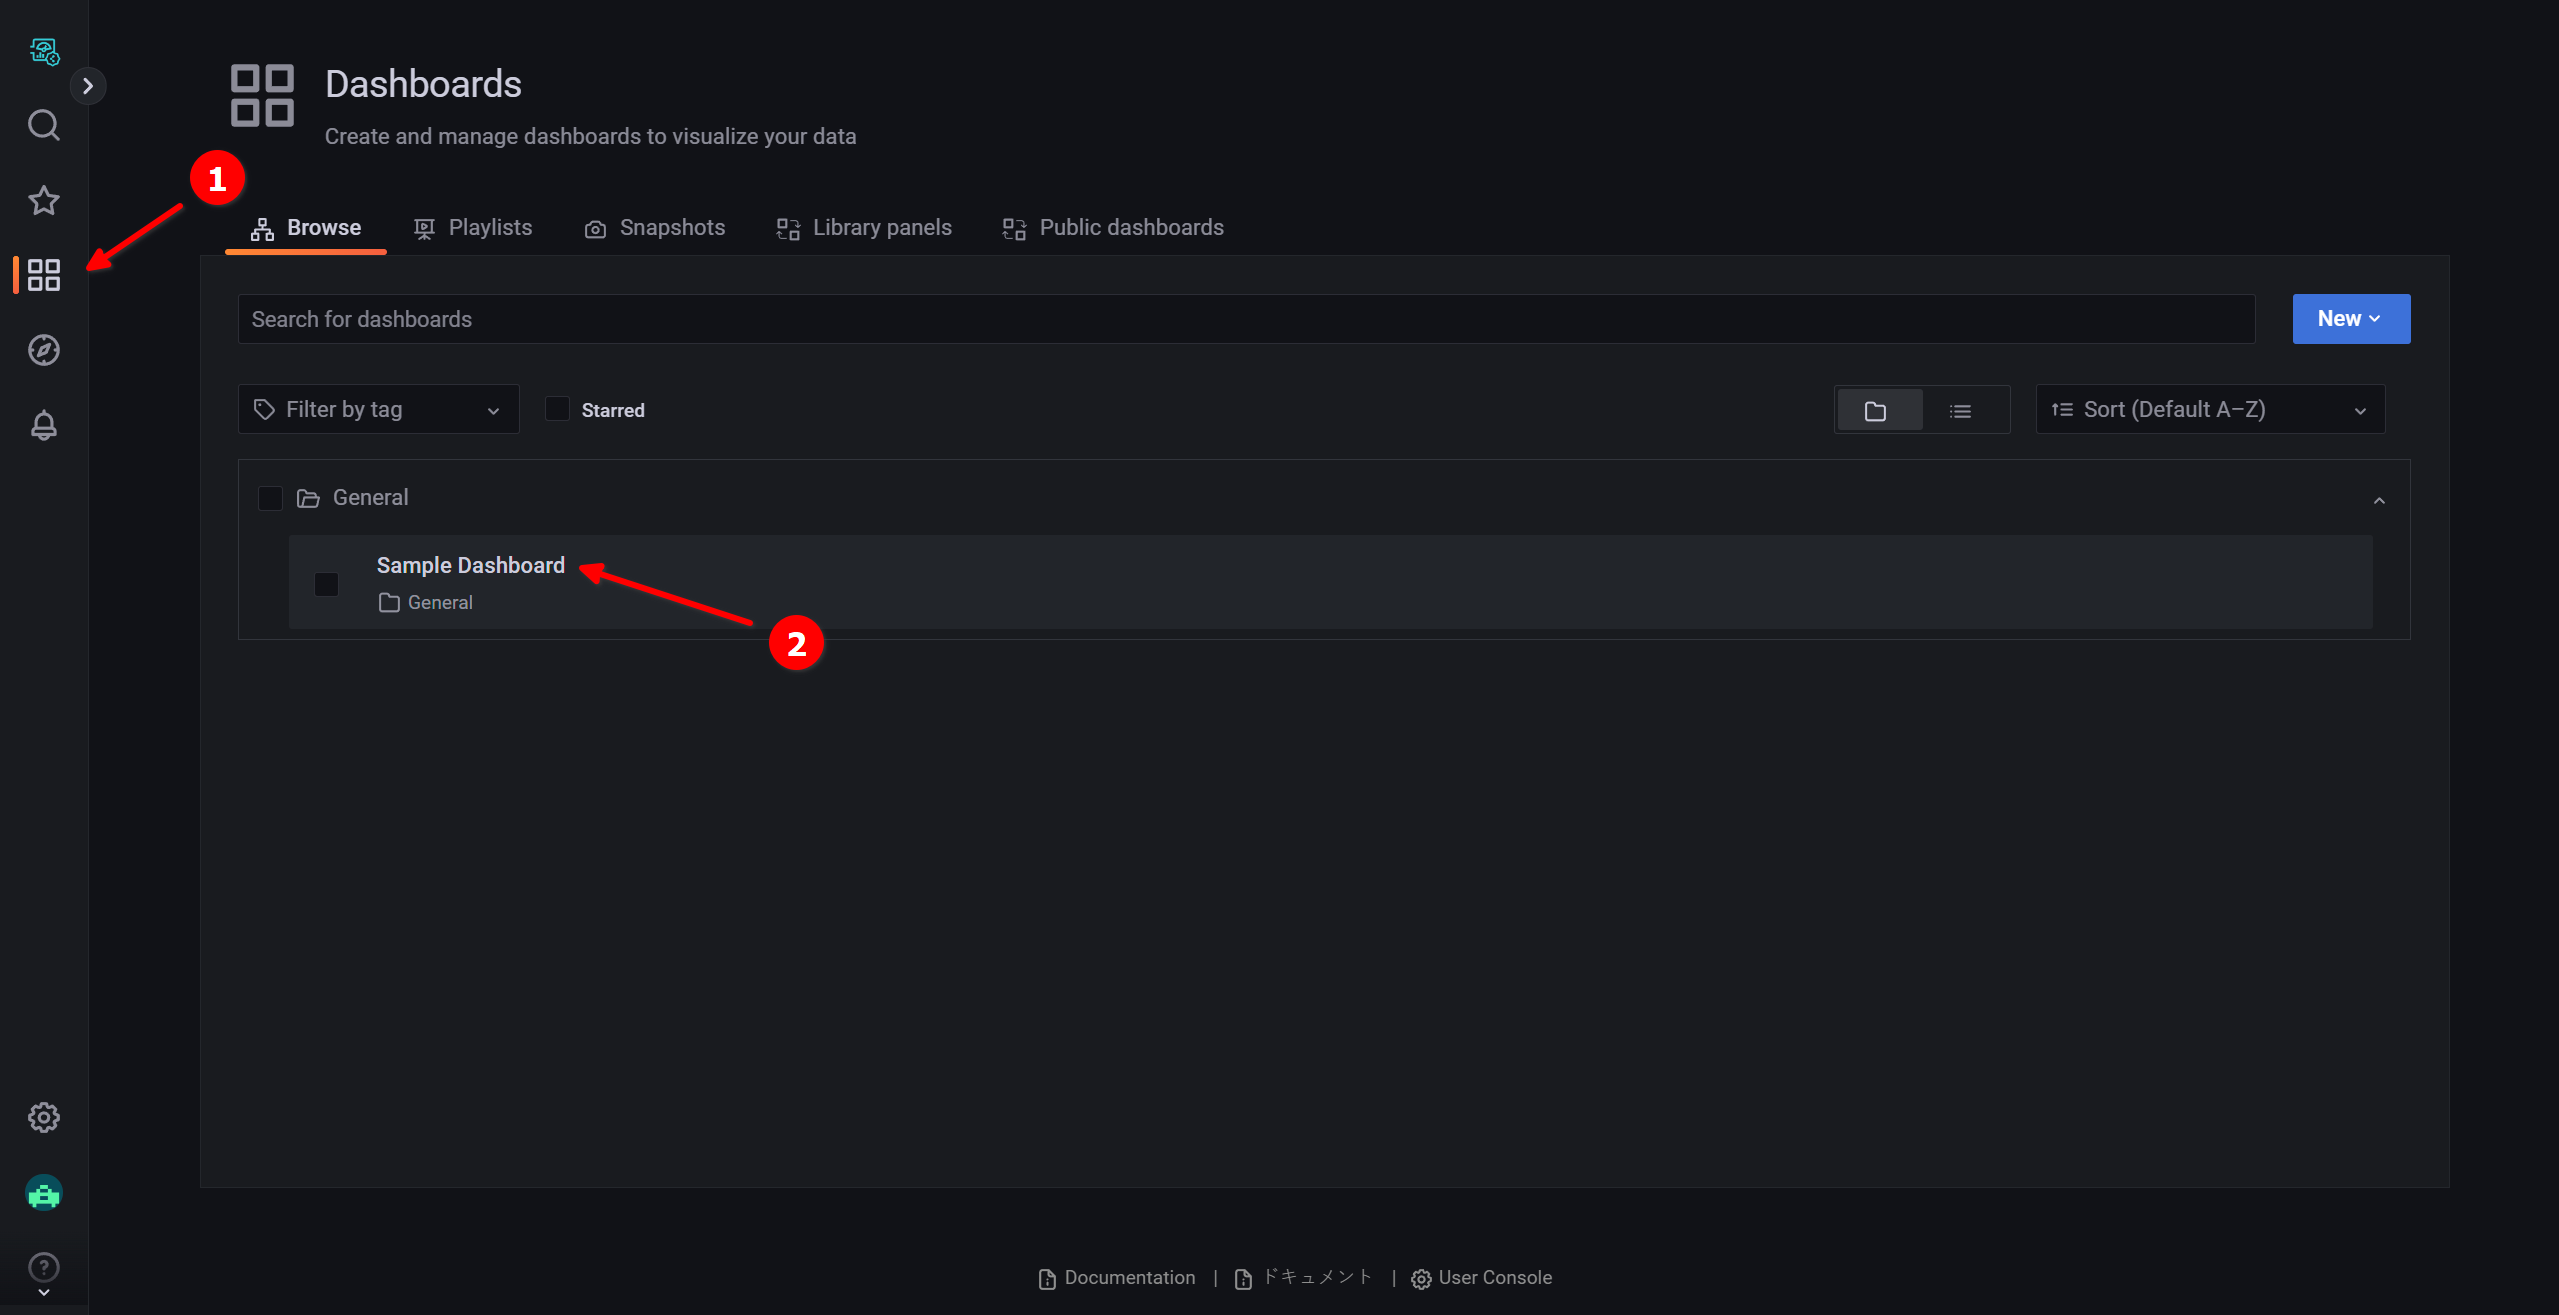
Sign in to the Lagoon console and click Dashboards, then New, then New Dashboard.
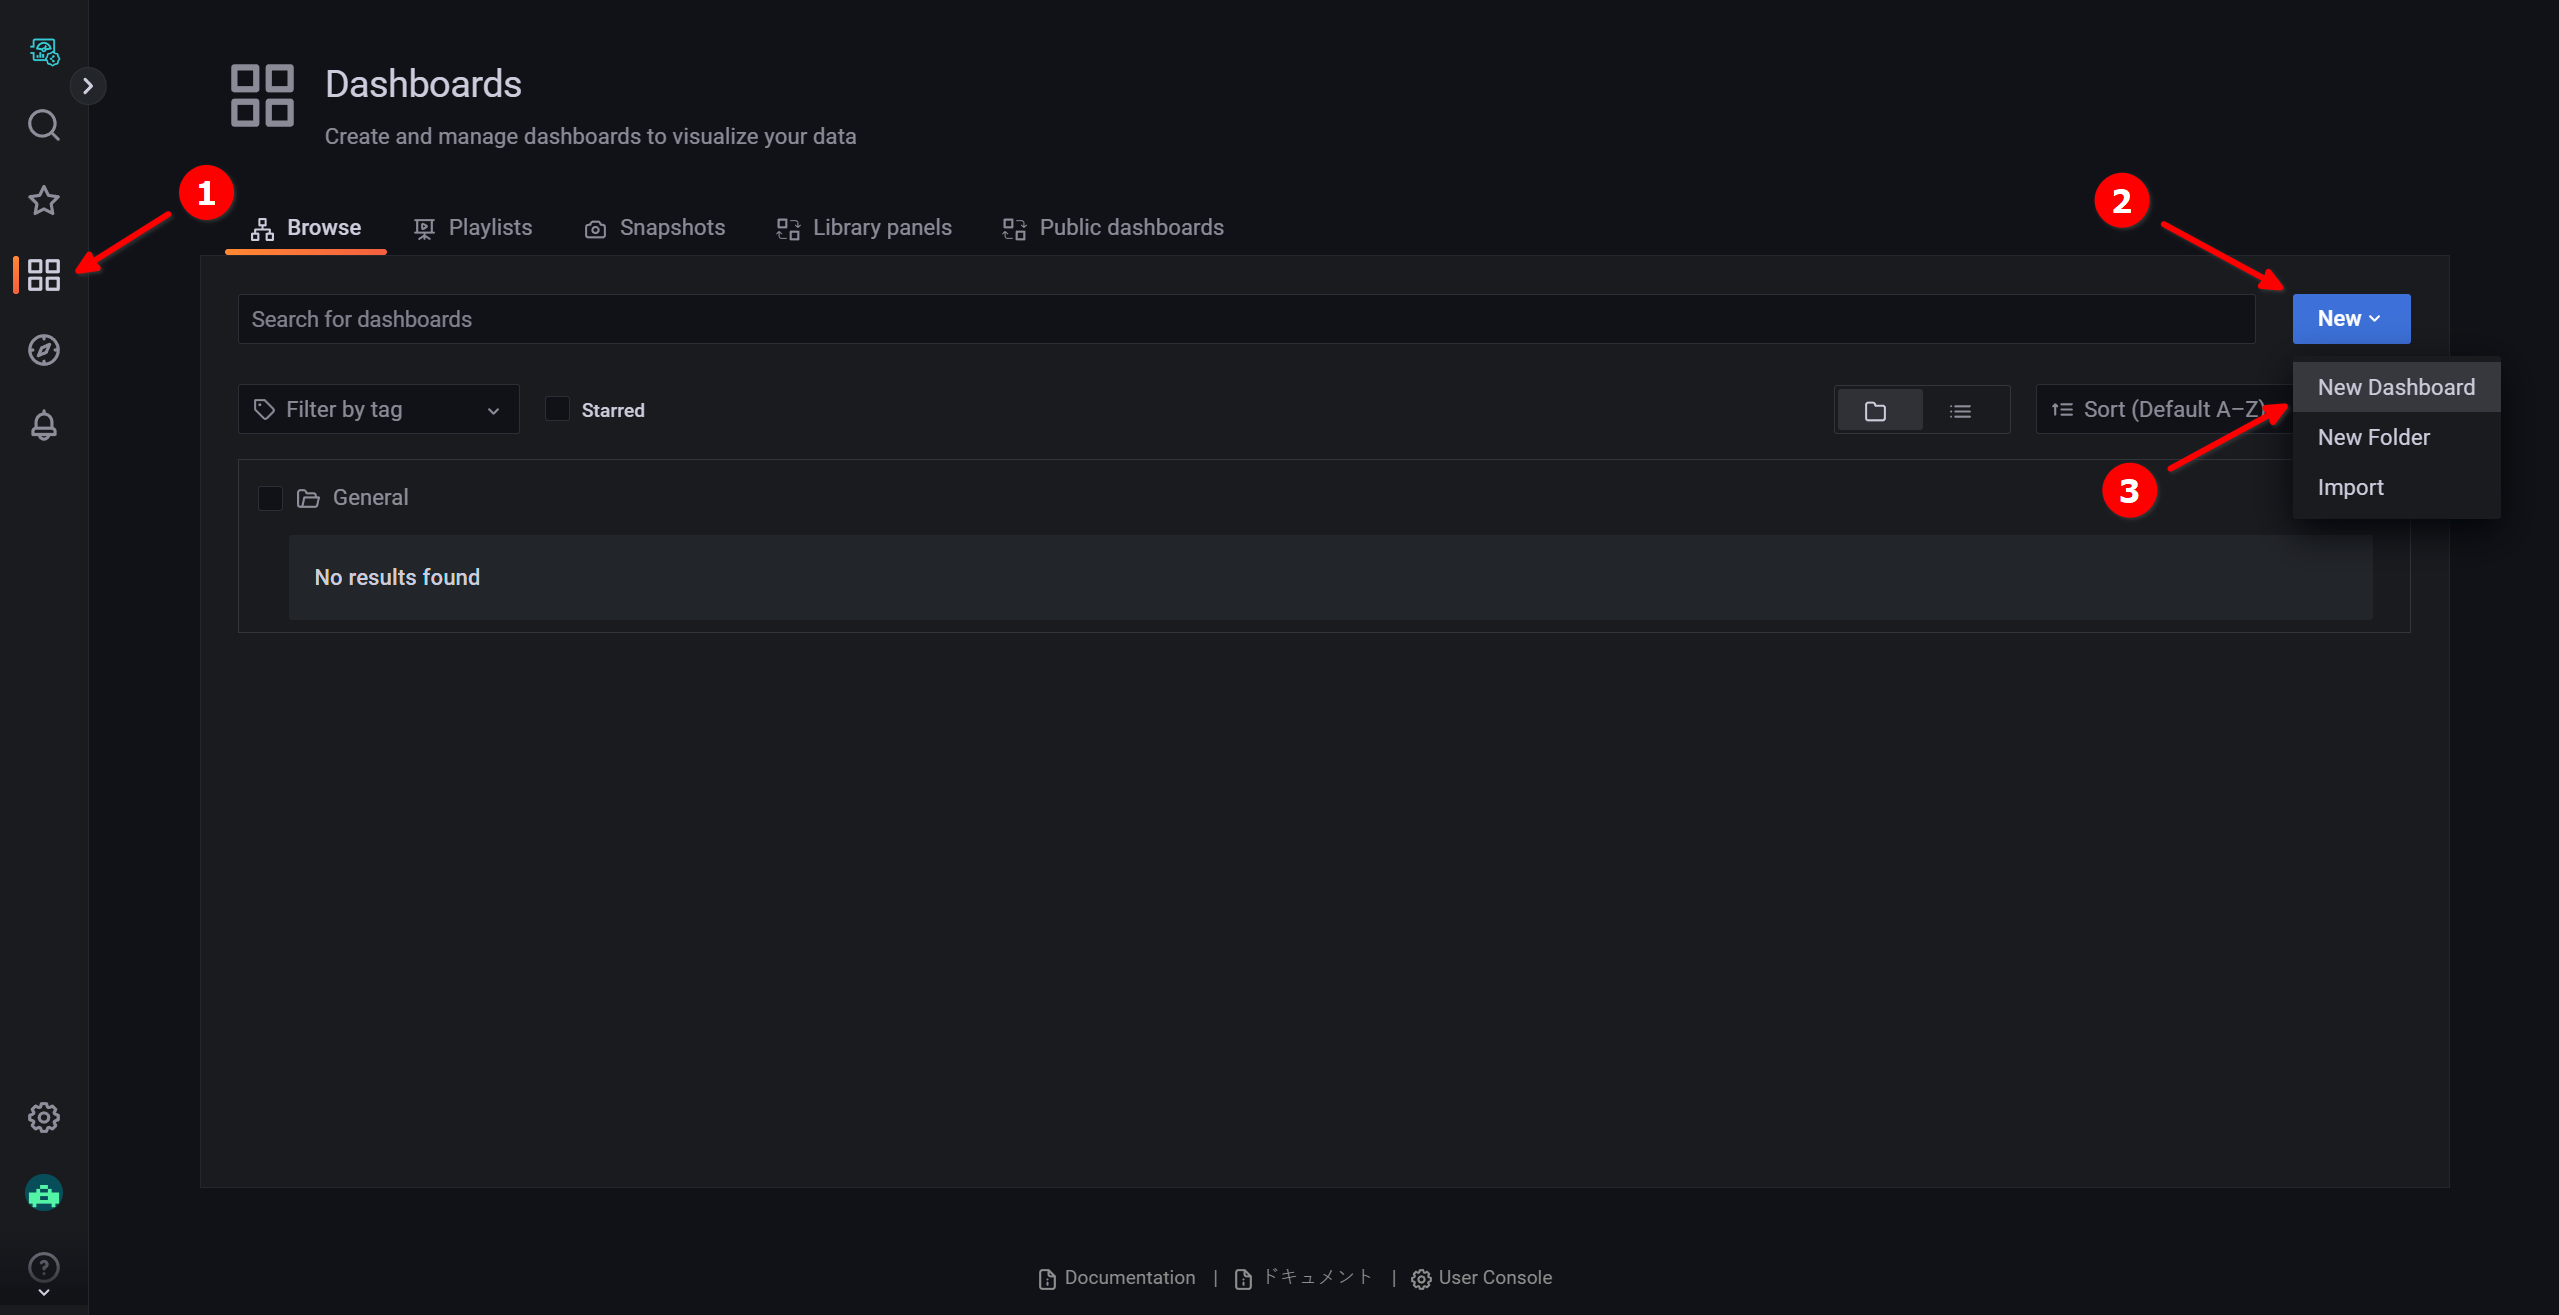
A Dashboard named New dashboard is created.
-
Click
 Add panel, followed by Add a new panel.
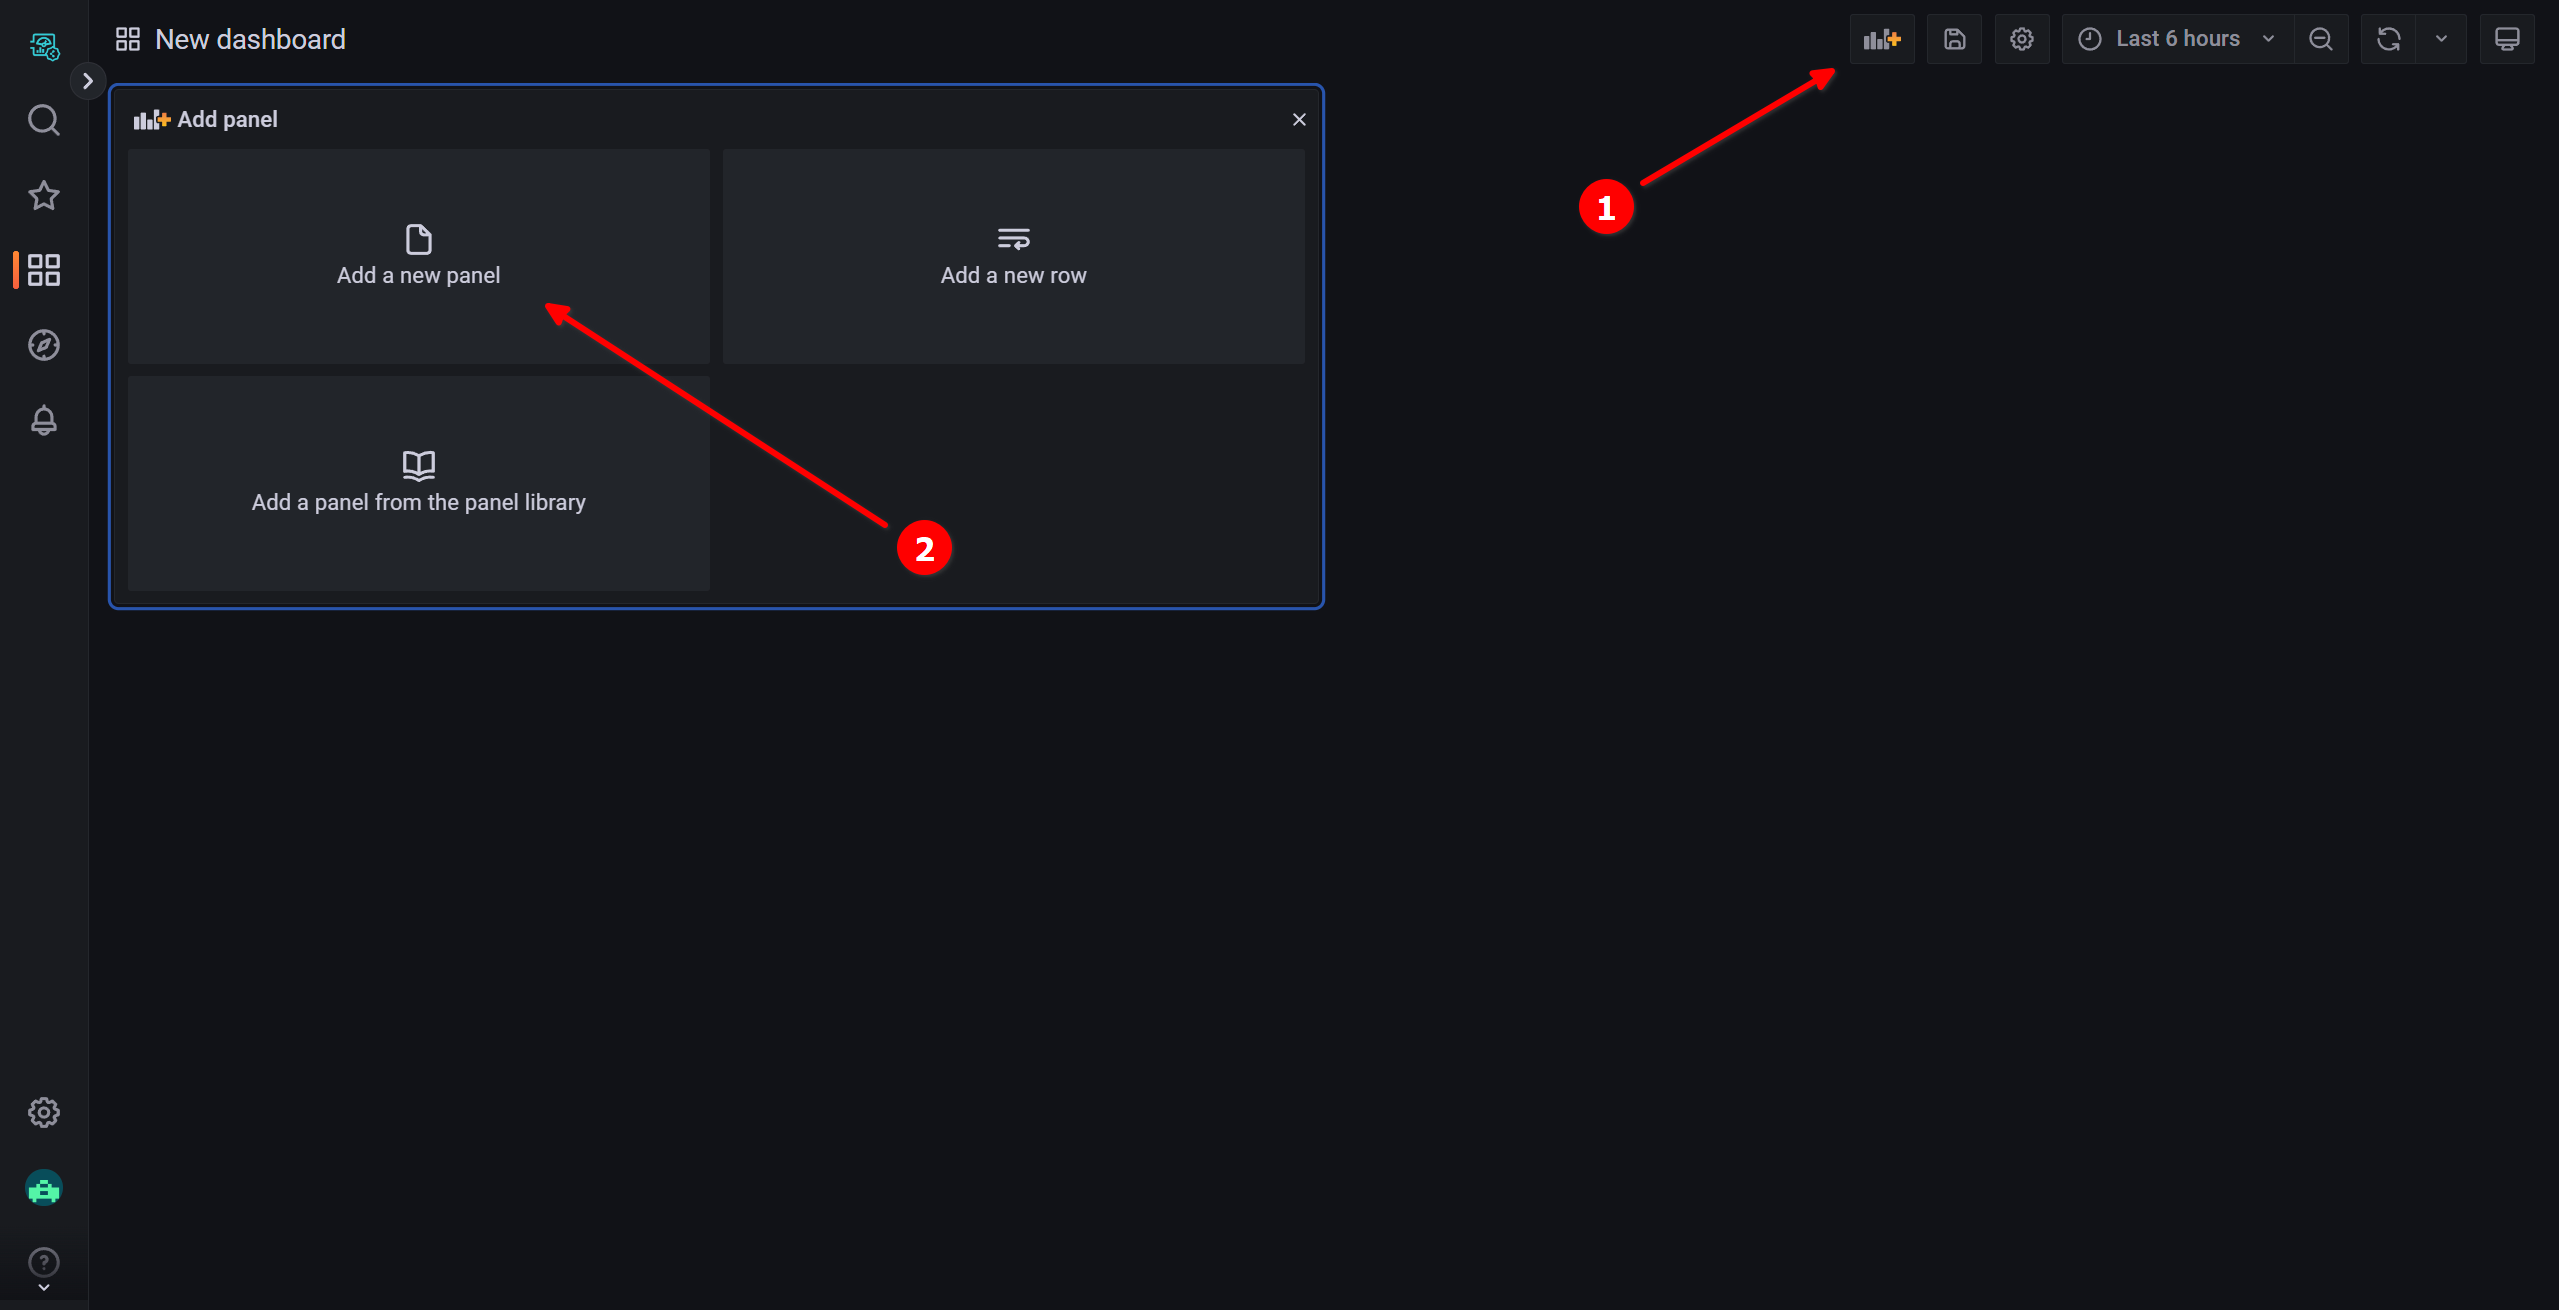
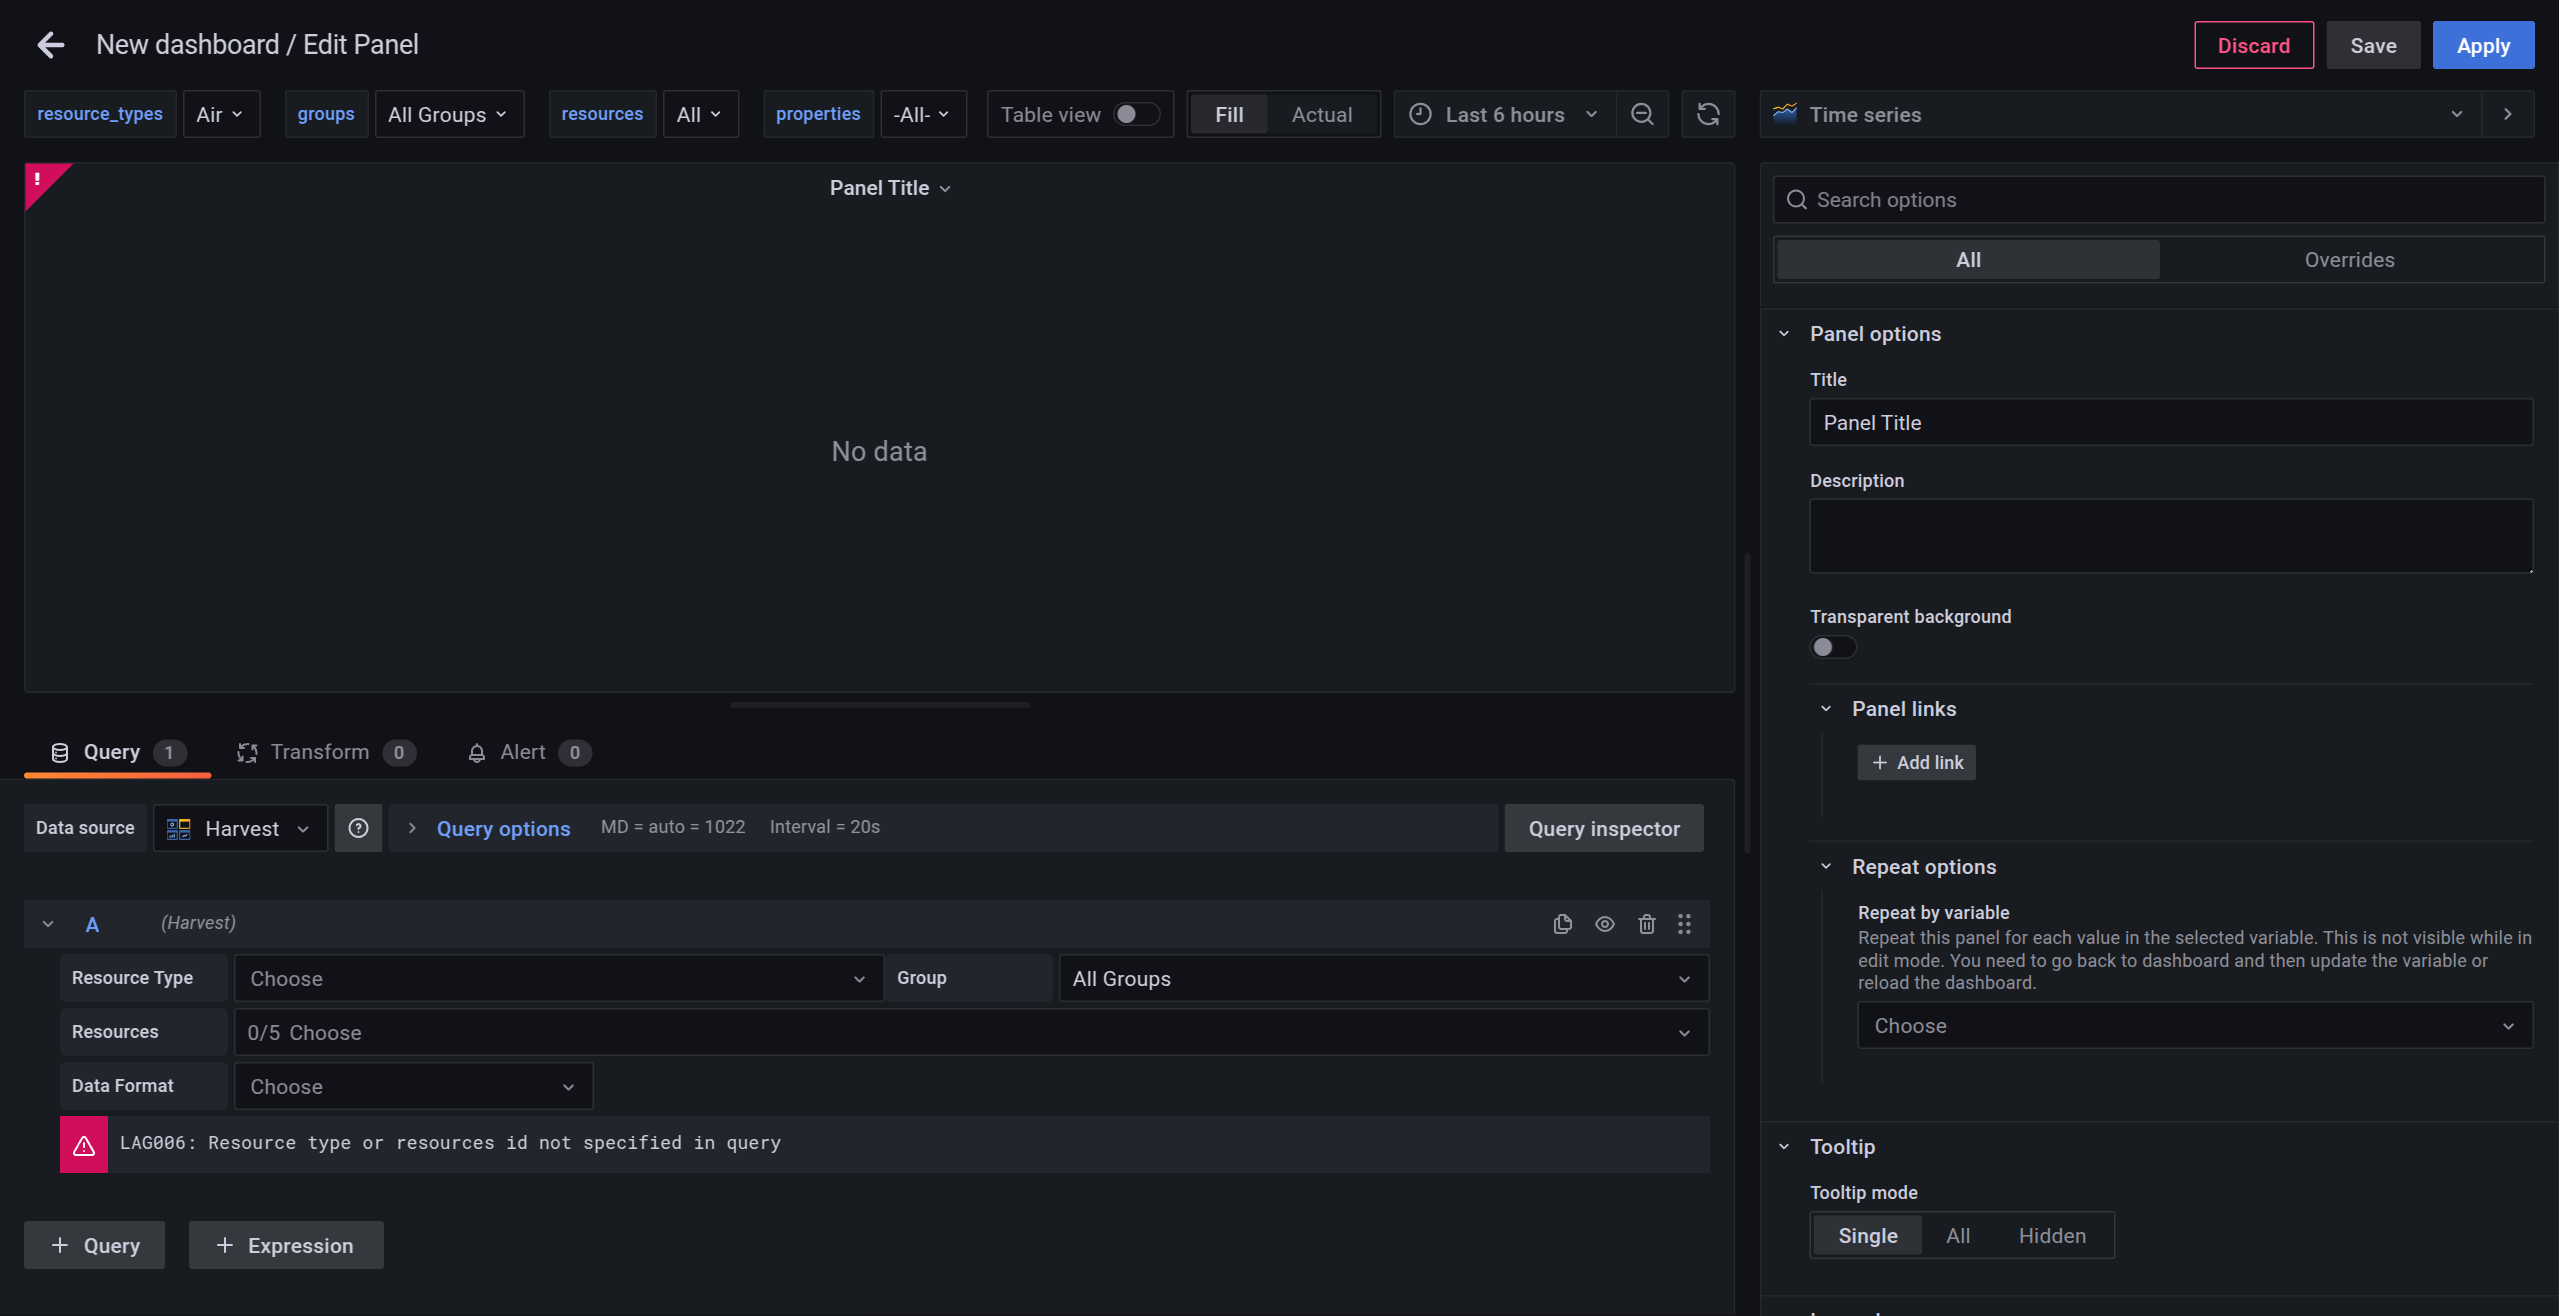
The Edit Panel screen appears.
Display Humidity and Temperature on the Panel
In the steps below, we will visualize the following sample data of Device-1 in a Time series panel.
- humidity
- temperature
The Demo sample data source also includes the following data:
- battery
- elevation
- latitude
- longitude
Time series is the default panel type. However, the latitude and longitude of a device can also be visualized on a map using the Soracom Map Panel.
-
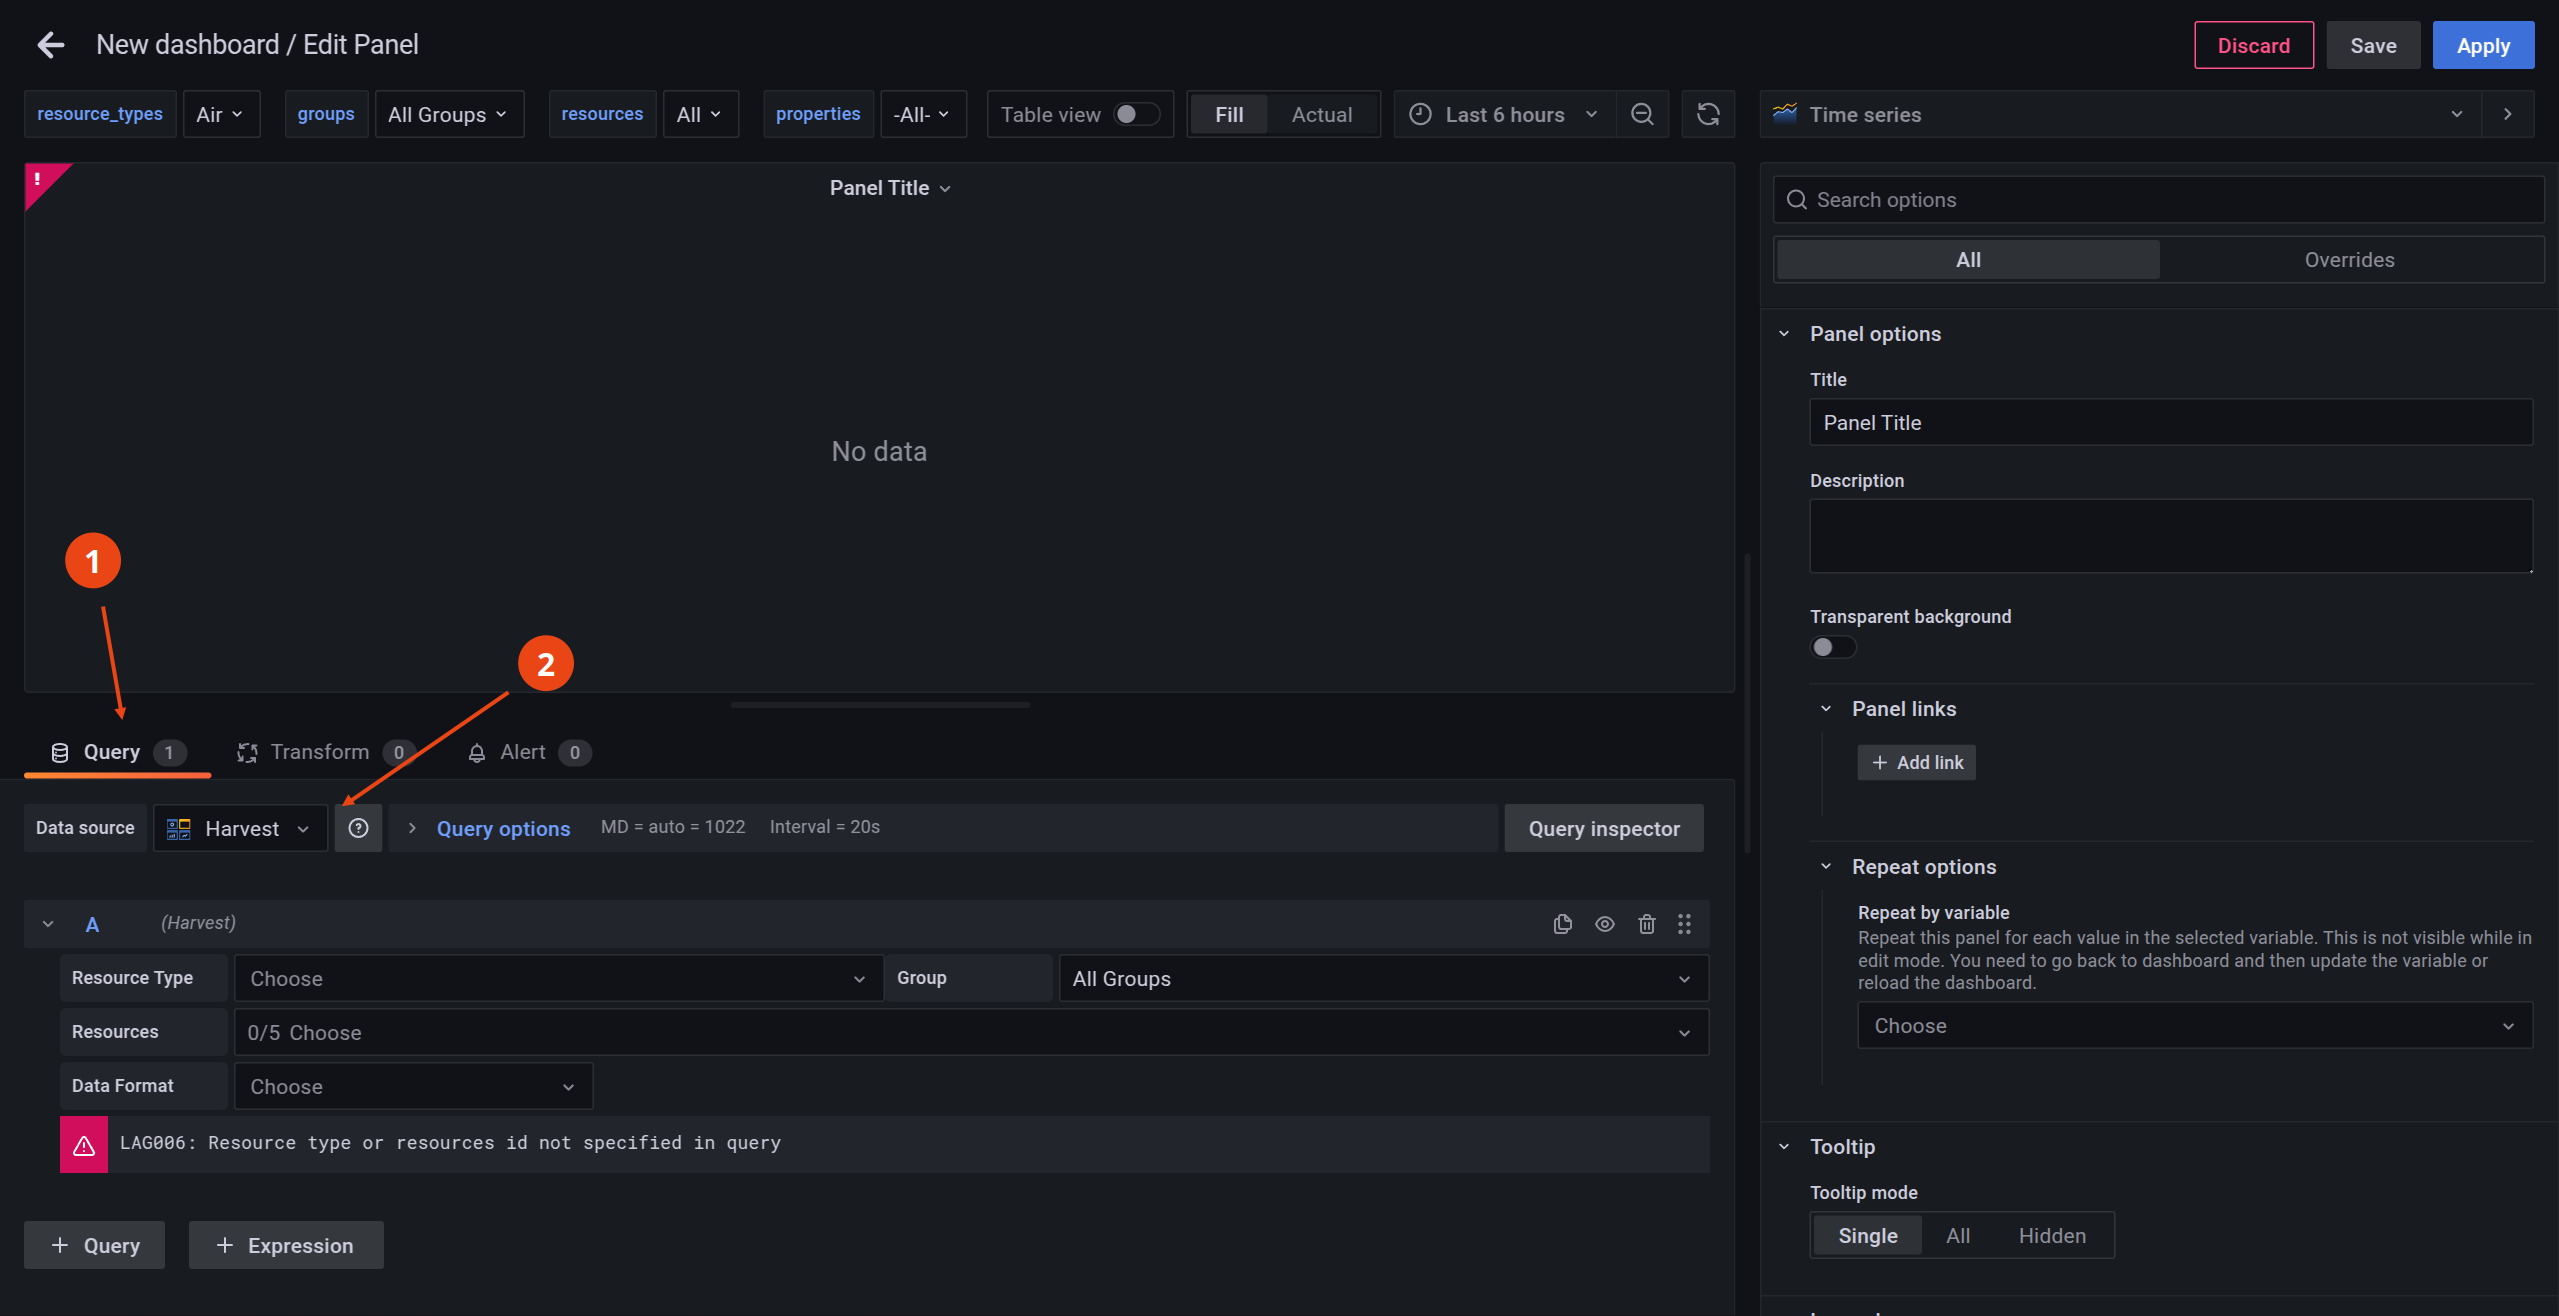
Click the Query tab and select Harvest (default) as the Data source.
-
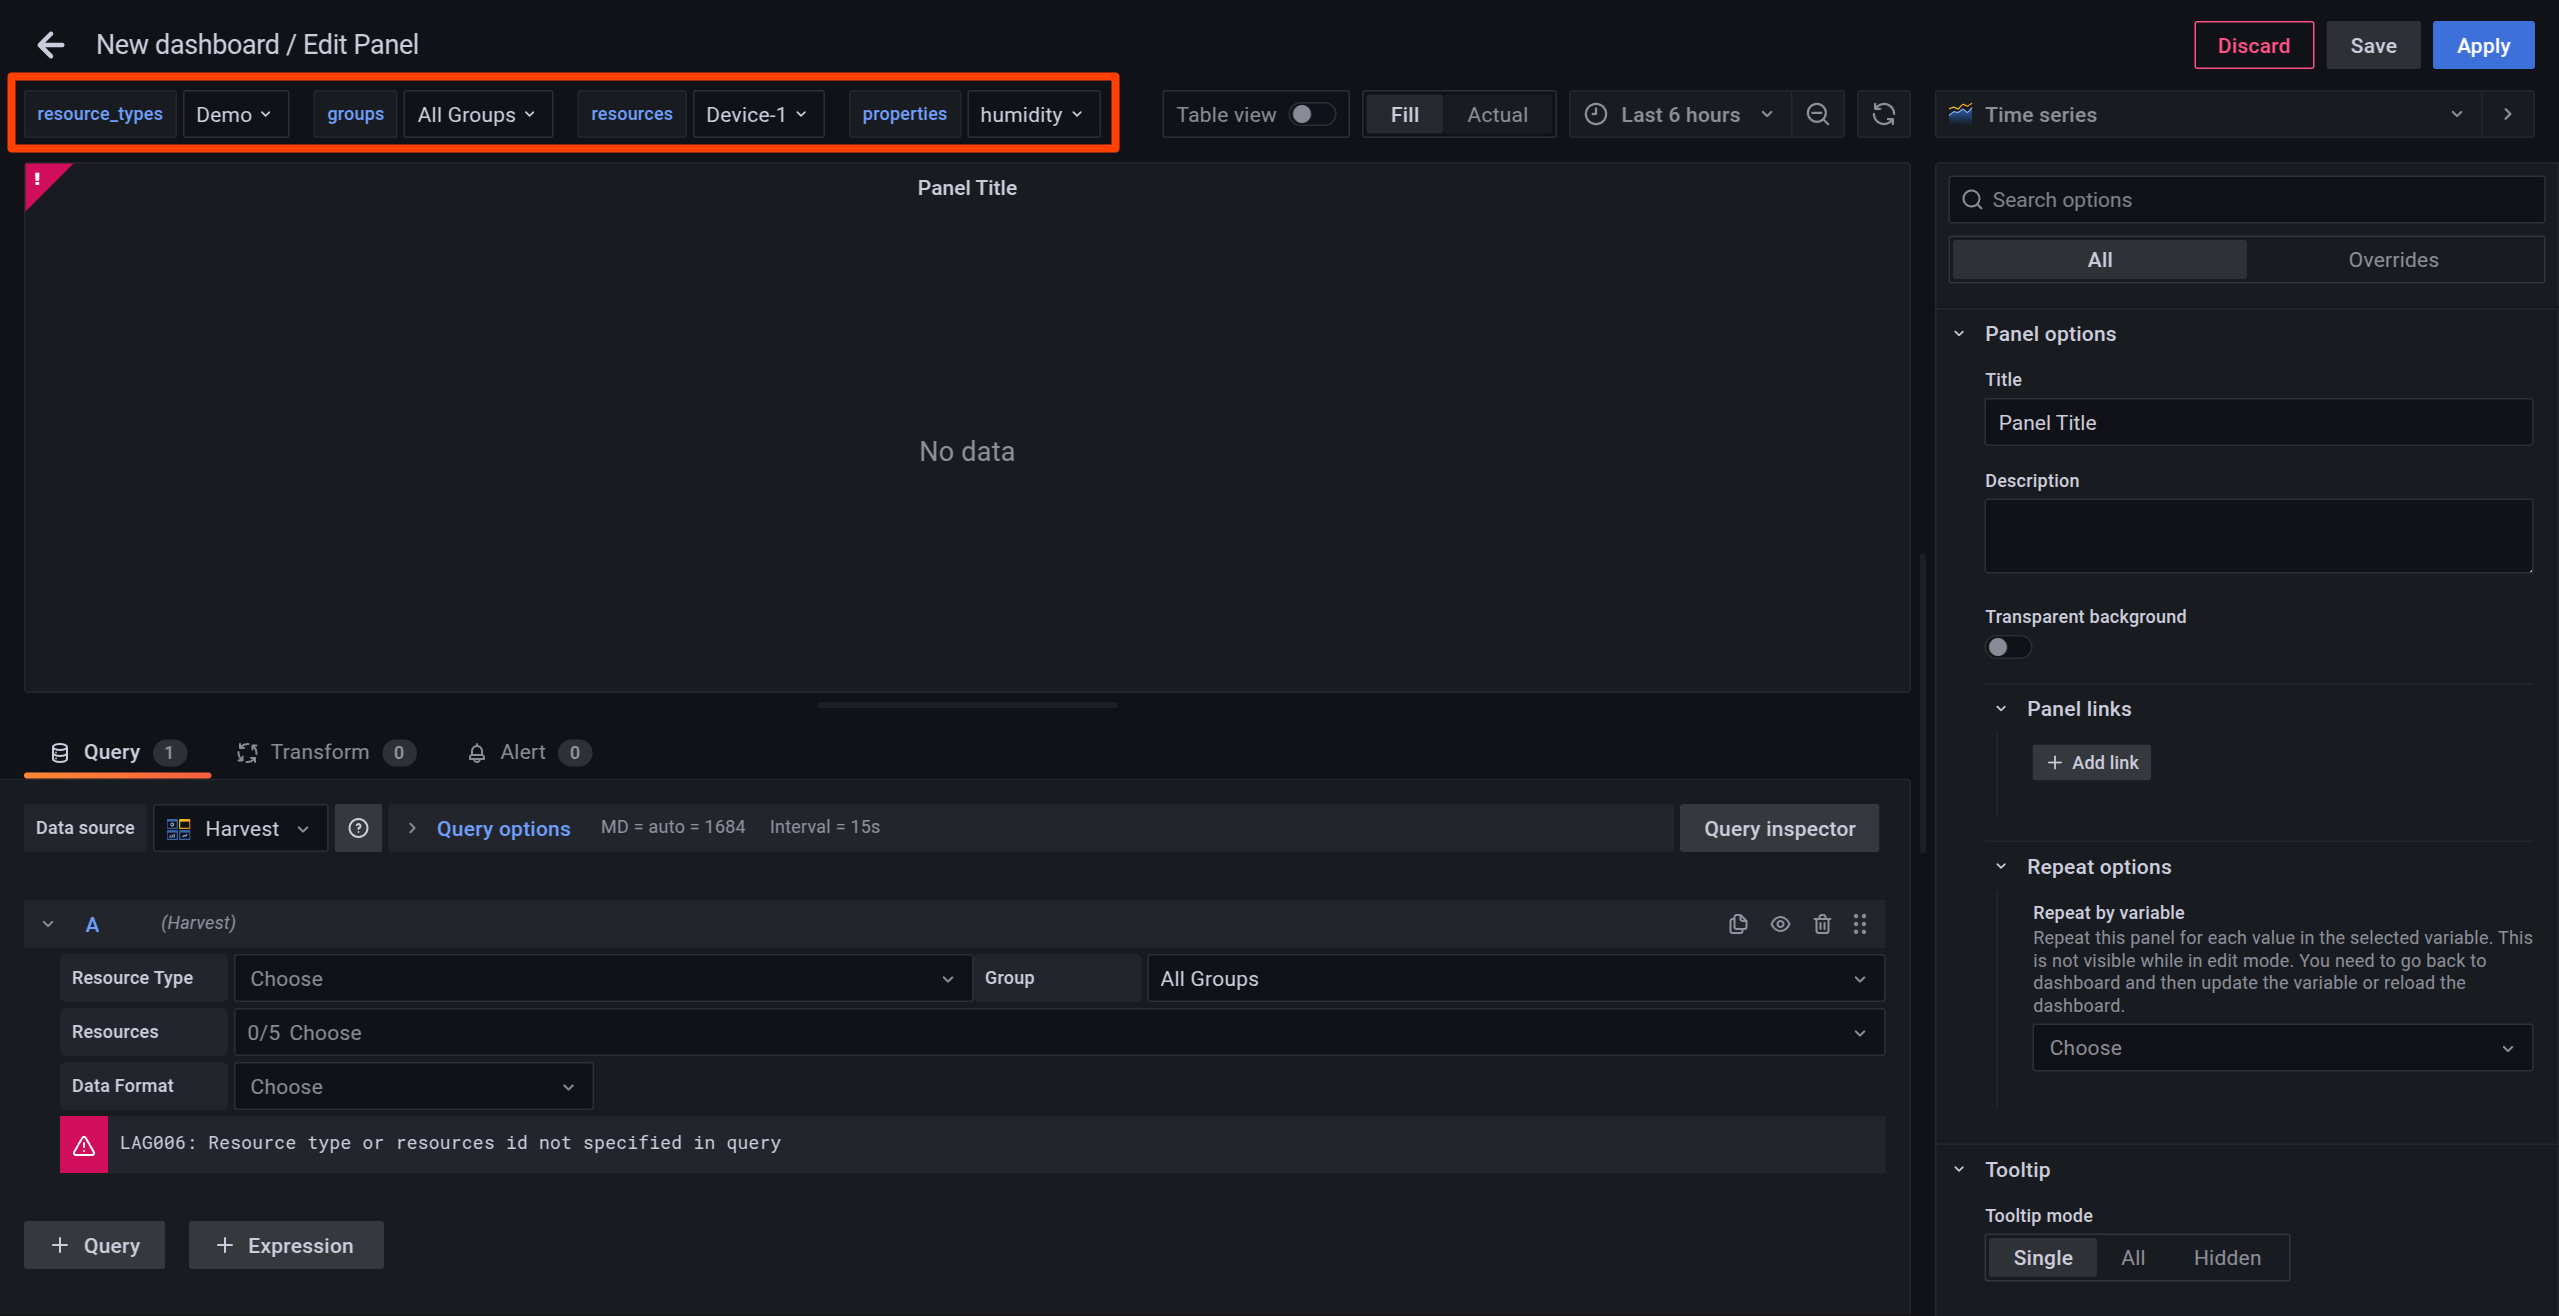
Using the variable dropdowns at the top of the screen, set the following options:
- resource_types: Select
Demo - groups: Select
All Groups - resources: Select
Device-1 - properties: Select
humidity
- resource_types: Select
-
Set Query A as follows using the dropdowns at the bottom:
- Resource Type: Select
$resource_types - Group: Select
$groups - Resources: Select
$resources - Data Format: Select
Standard - Properties: Select
$properties
The query editor dropdowns can be searched by typing the first few letters of the desired value.
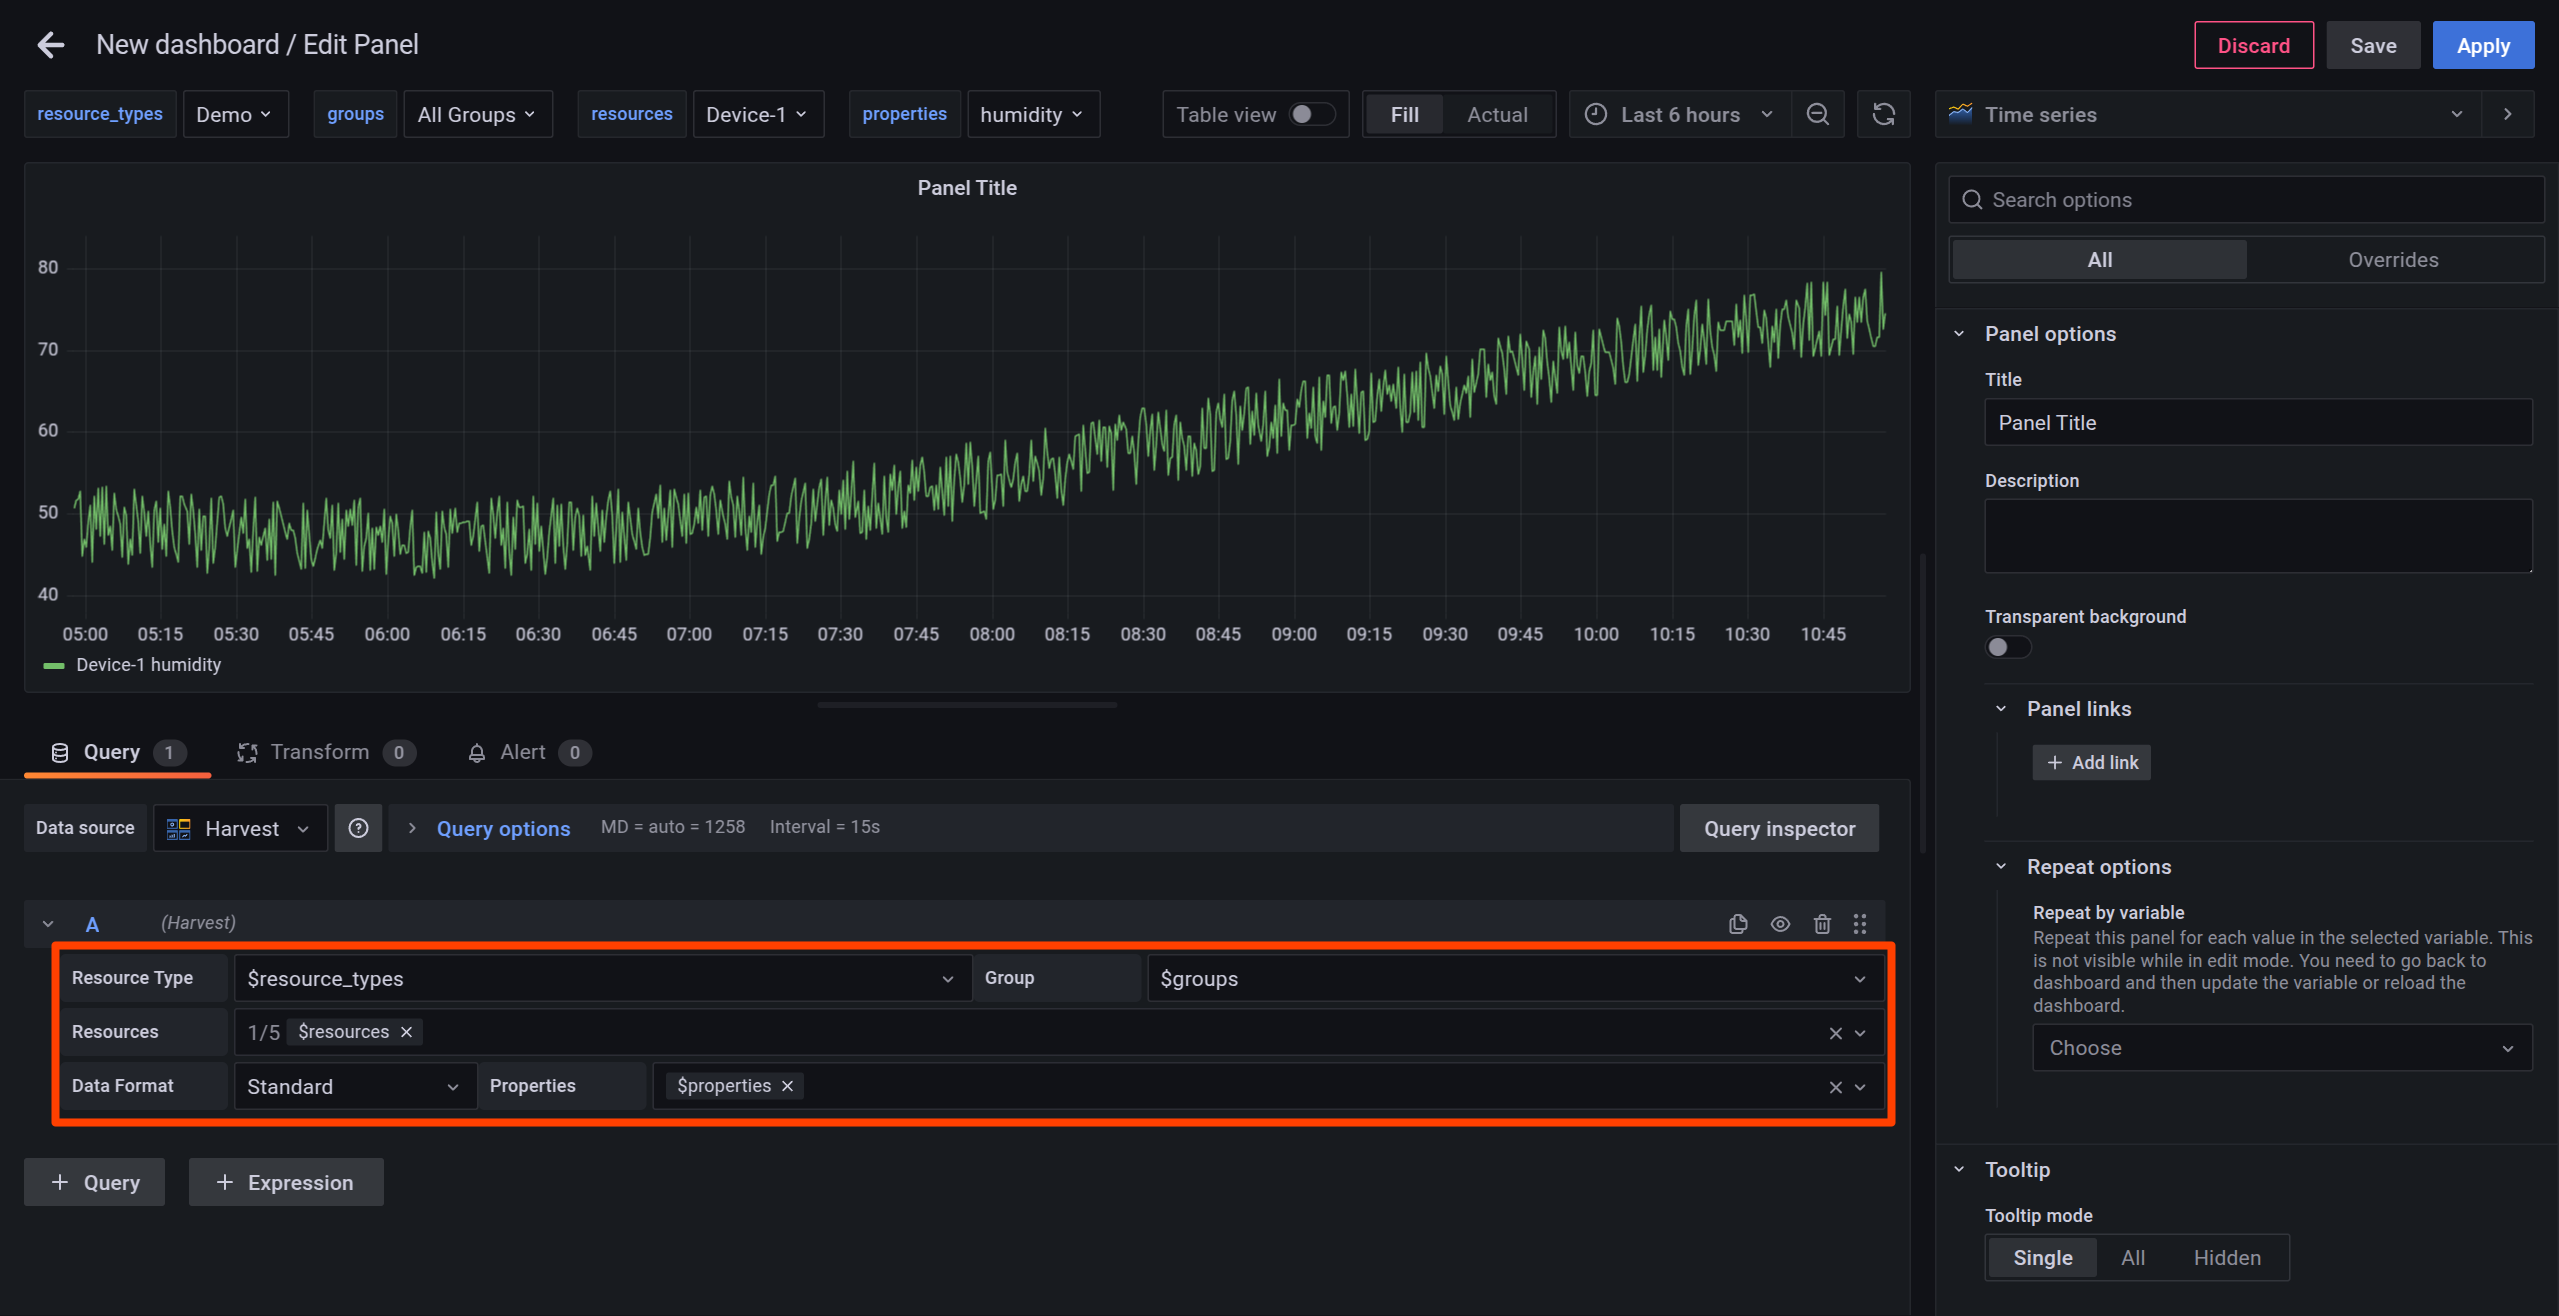
A graph of humidity is displayed.
Variables prefixed with
$are dynamic and allow switching displayed data on the dashboard without modifying panel settings. Refer to Using Variables to Switch Data Displayed in the Panel for more information on using template variables.Refer to Using the Query Editor for more information on configuring queries.
- Resource Type: Select
-
Next, using the variable dropdowns at the top of the screen, select both
temperatureandhumidityunder properties.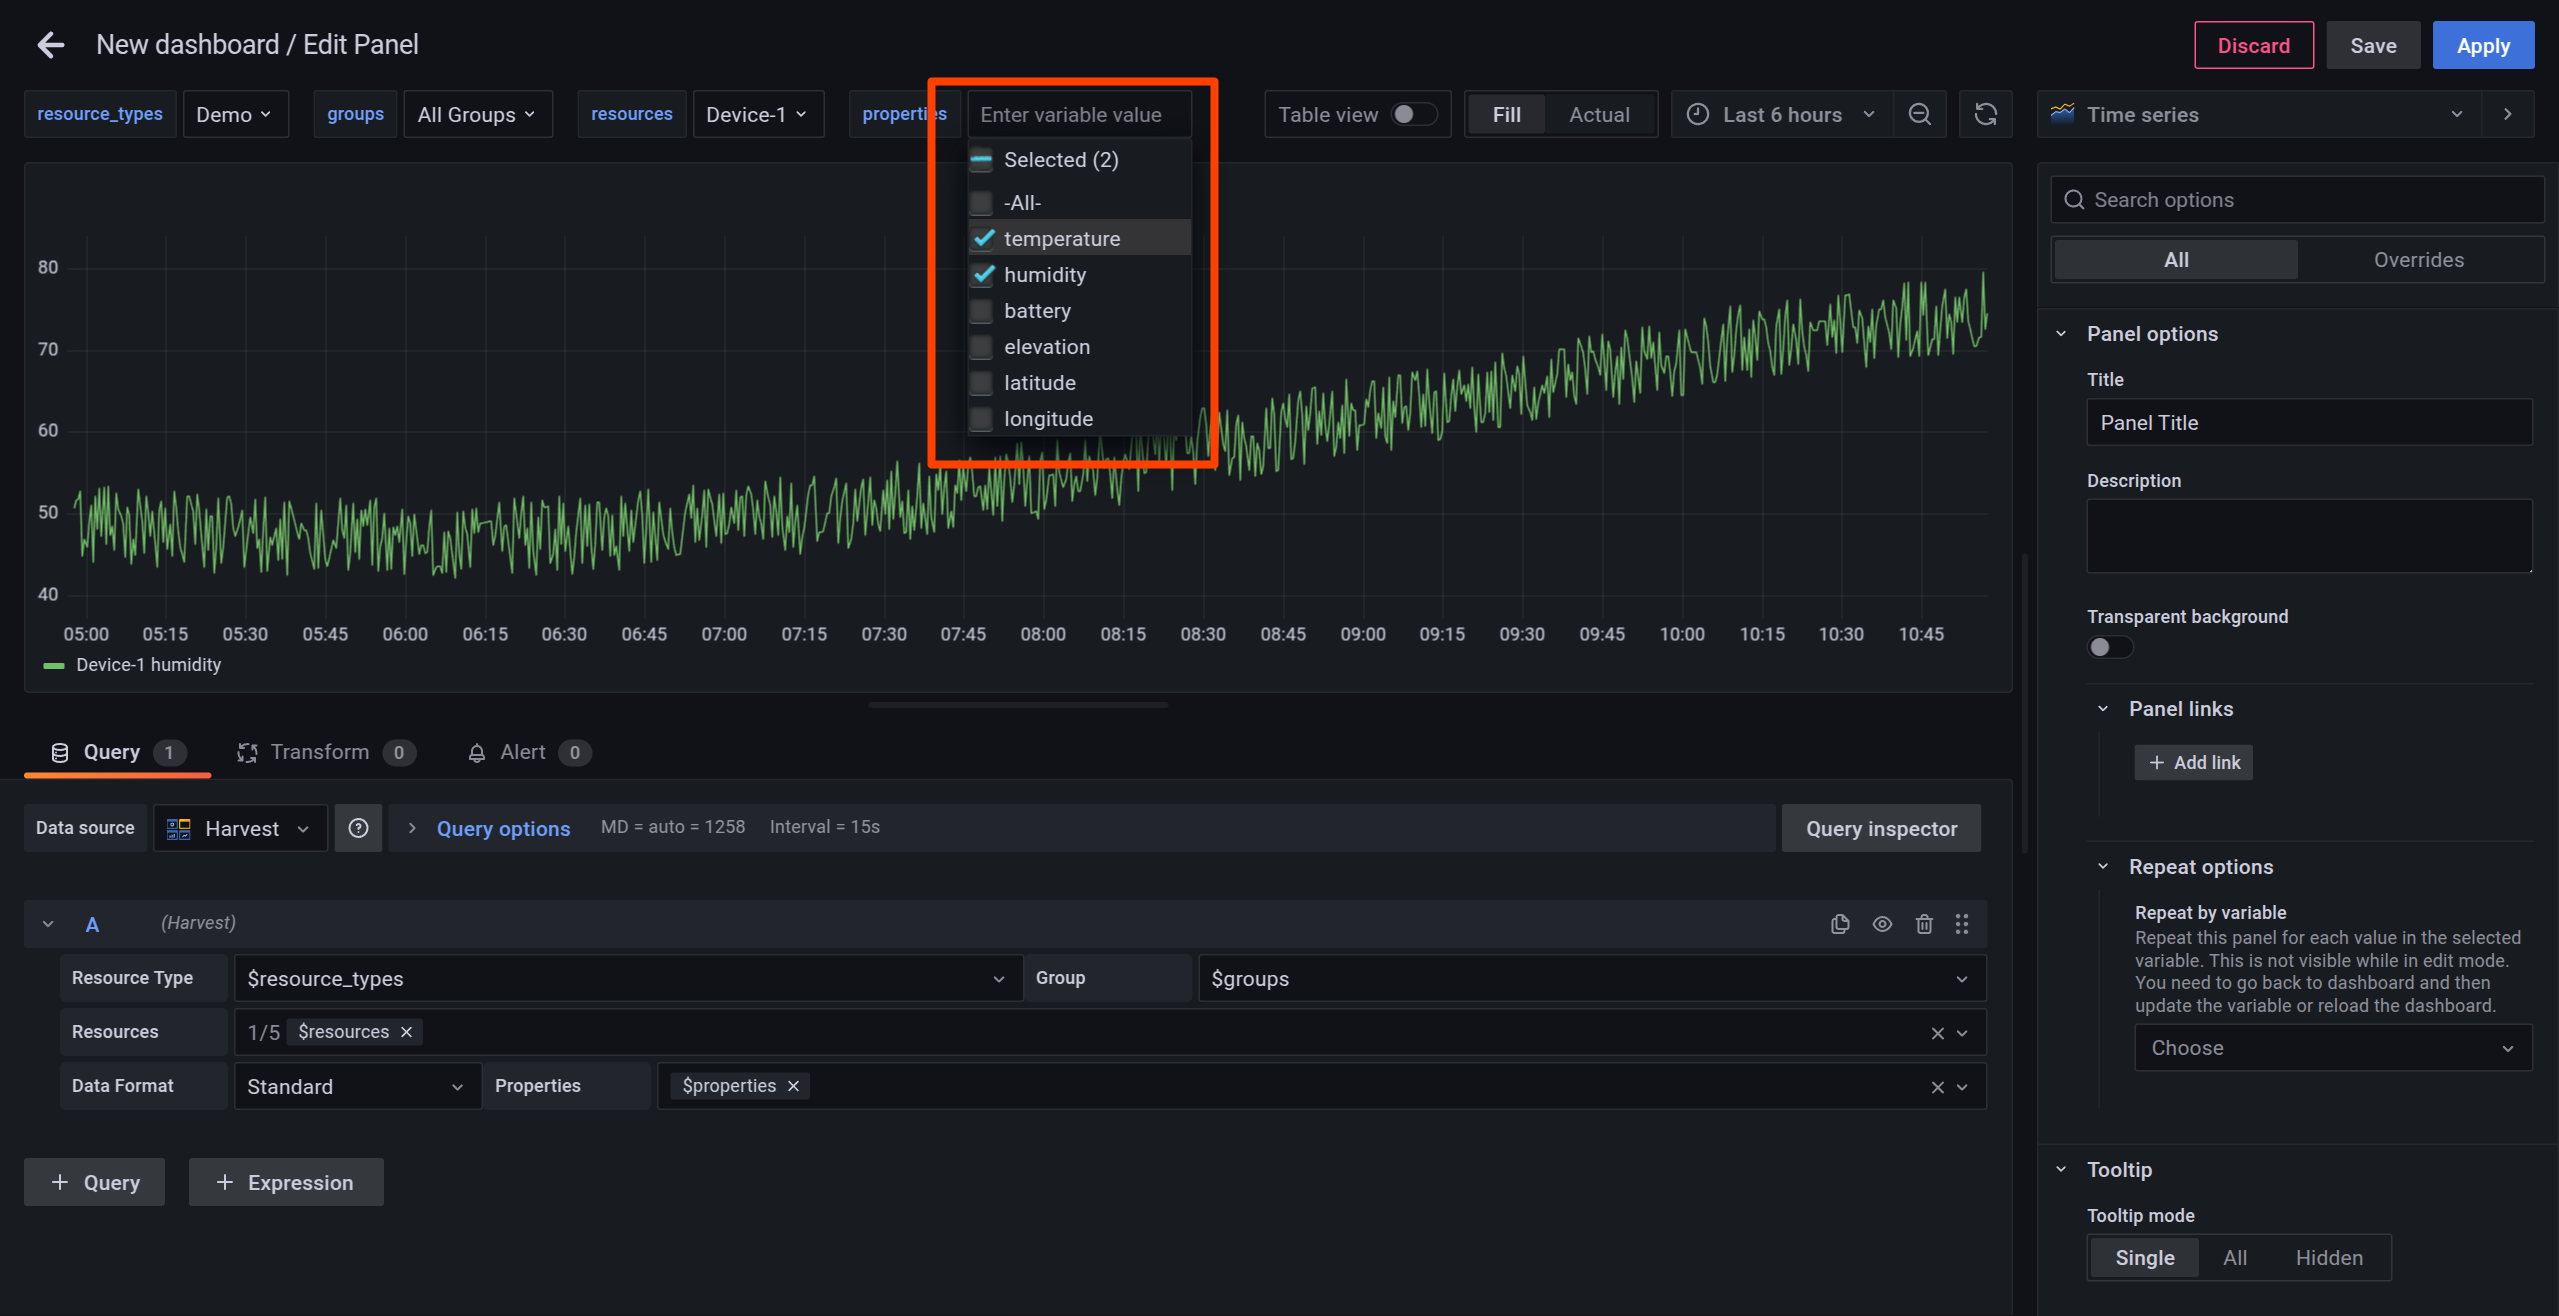
A graph of temperature is added.
Set the Panel Title
By default, Panel Title is displayed as the title of a panel. To change this, follow the steps below:
-
Click All, followed by expanding Panel options.
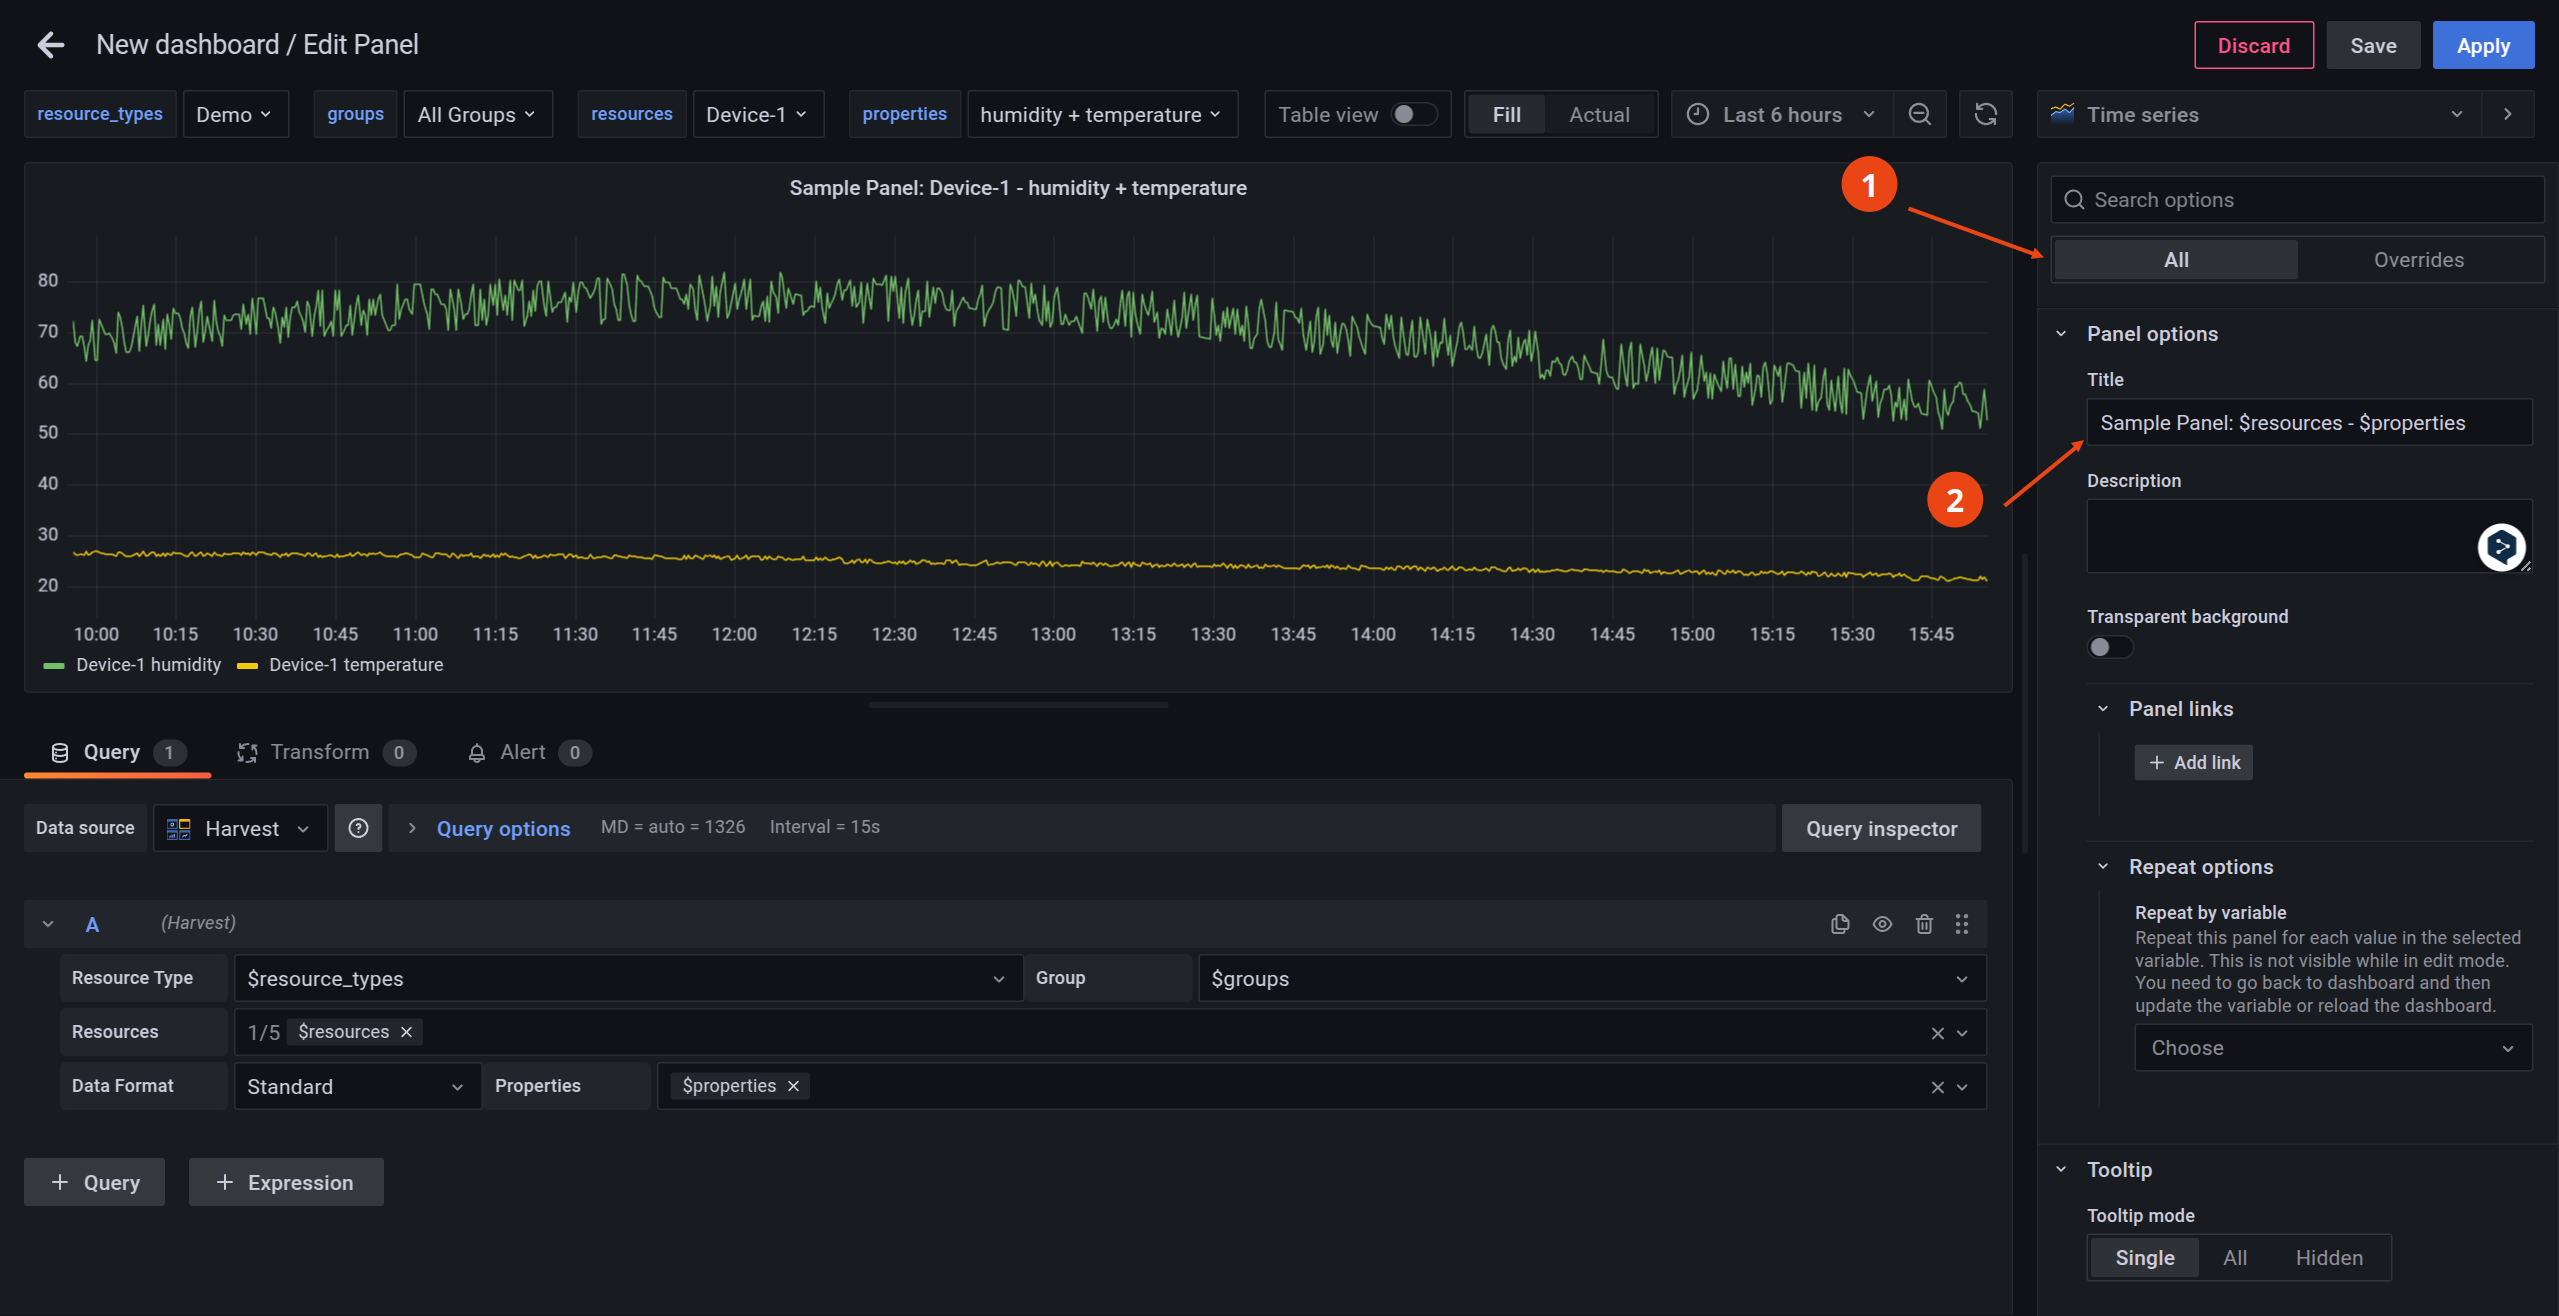
- Enter
Sample Panel: $resources - $propertiesin Title field. The variables$resourcesand$propertiesare replaced with the selected device and property names.
Configure Display Name and Unit Overrides
We can use Overrides to change how the data is identified and presented on the Time series panel. In this case we will adjust the Display name of the data as well as the Units being used to represent it.
-
Click Overrides, then Add field override, and complete the fields for
Override 1as follows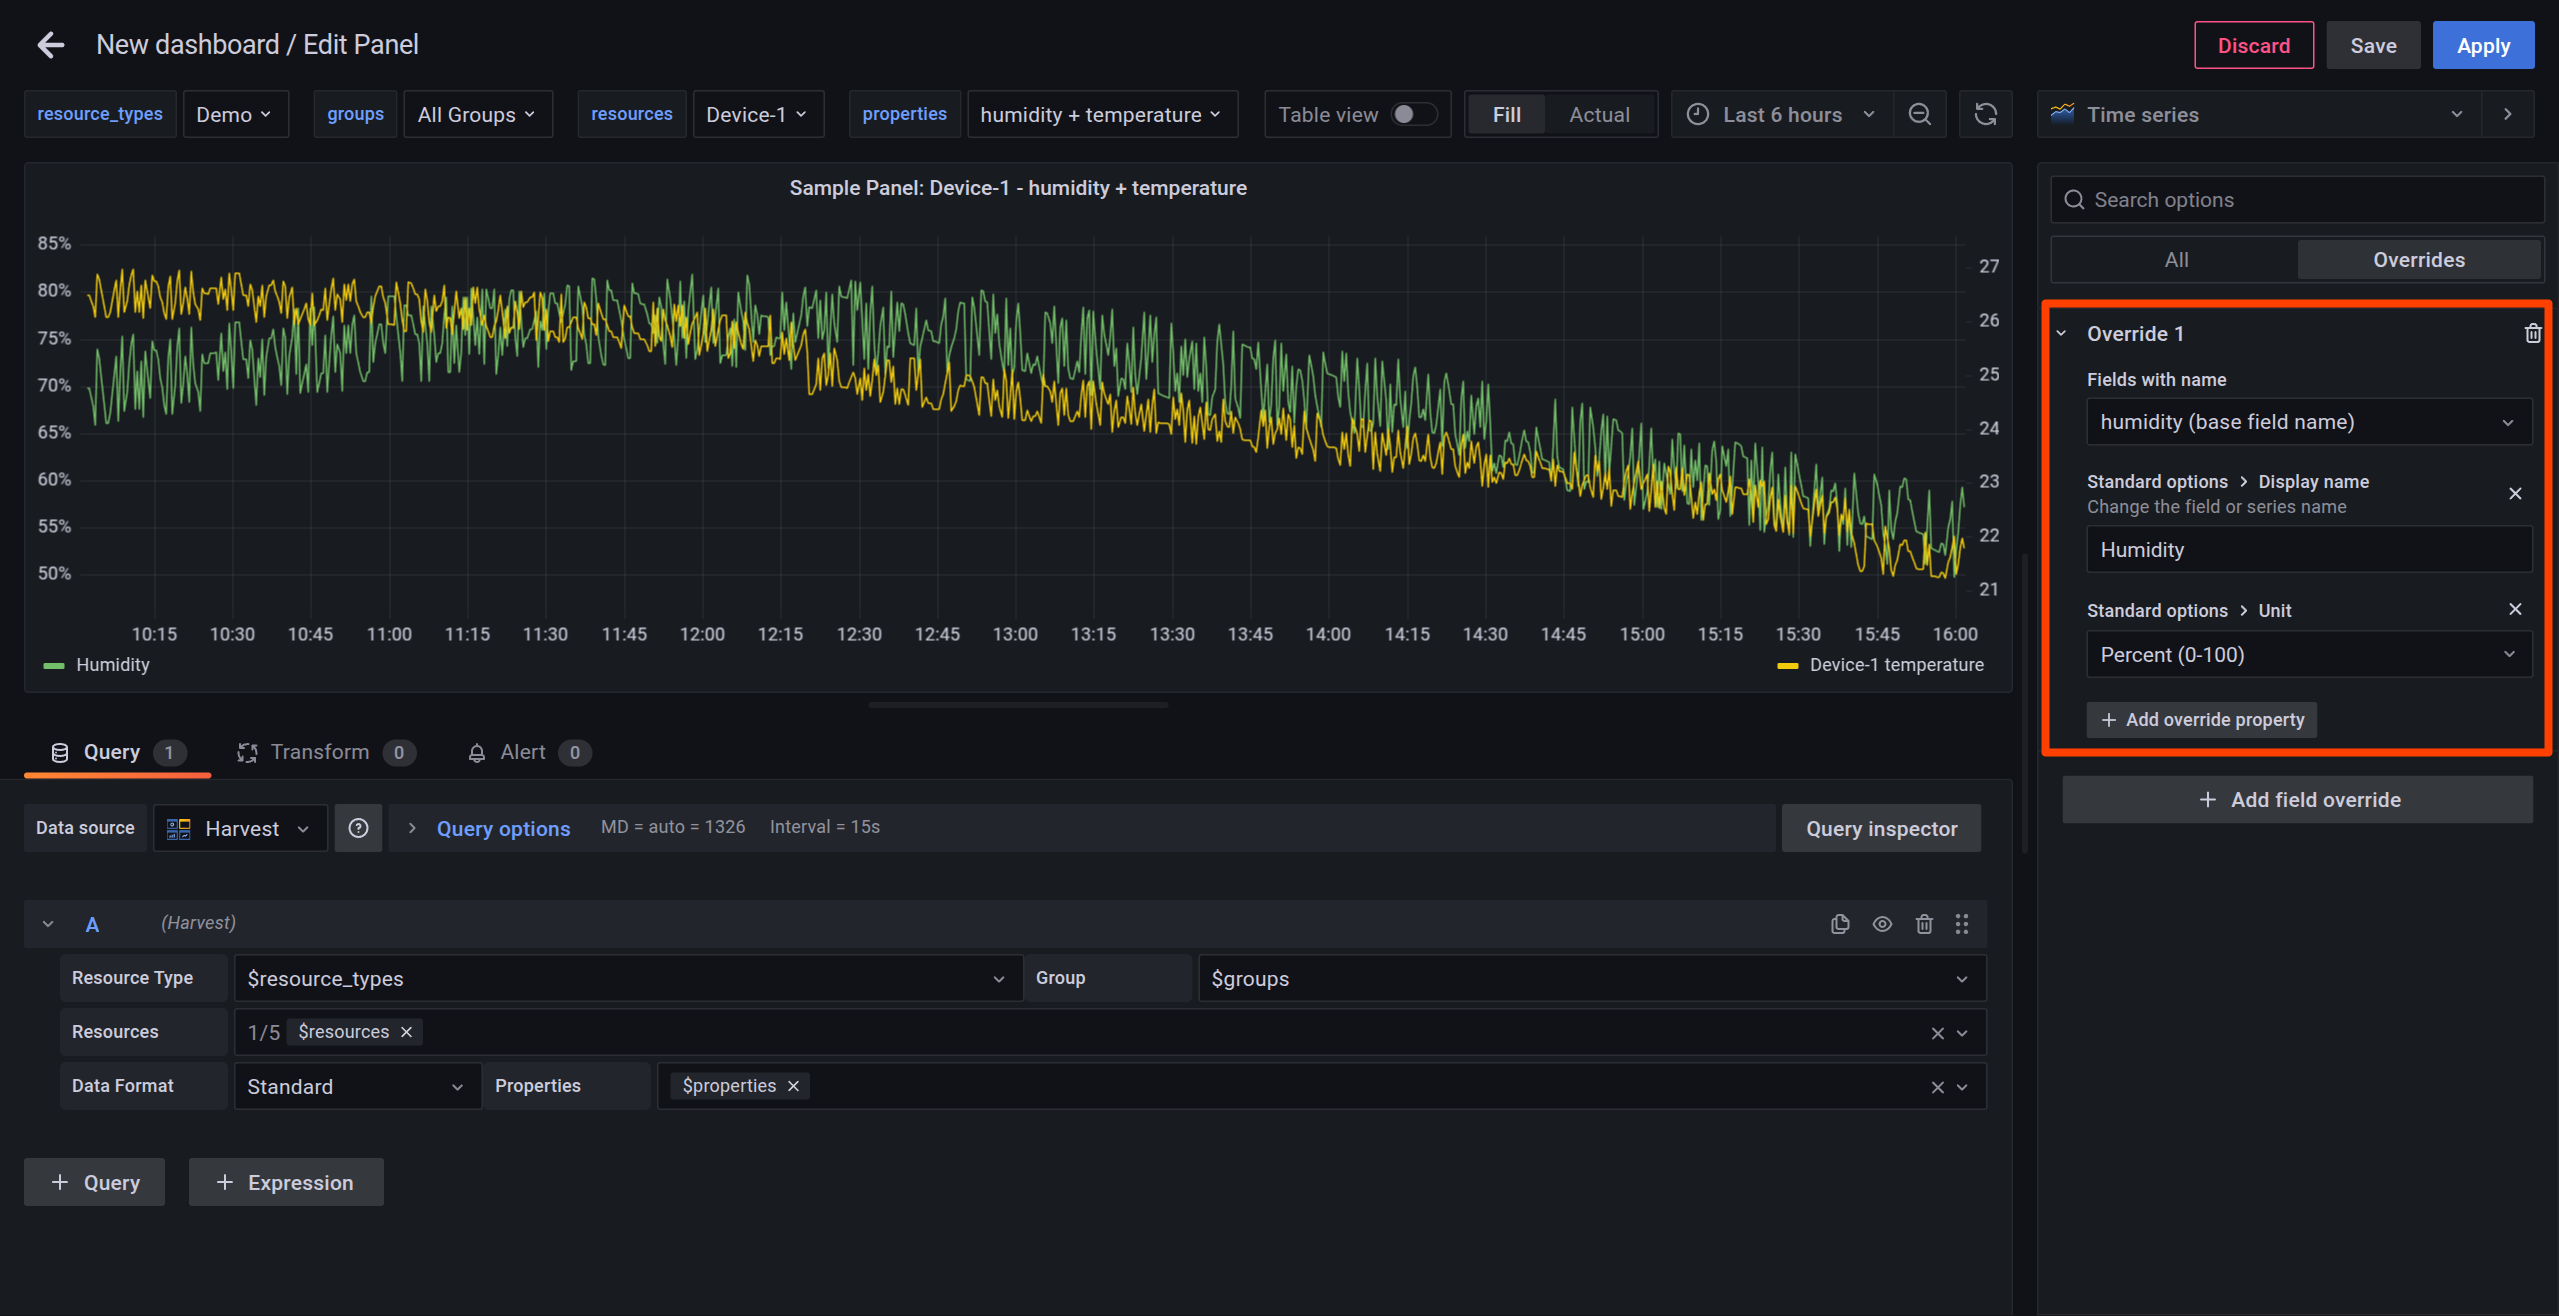
The humidity graph changes to a % display.
-
Next, click Add field override again and complete the fields for
Override 2as follows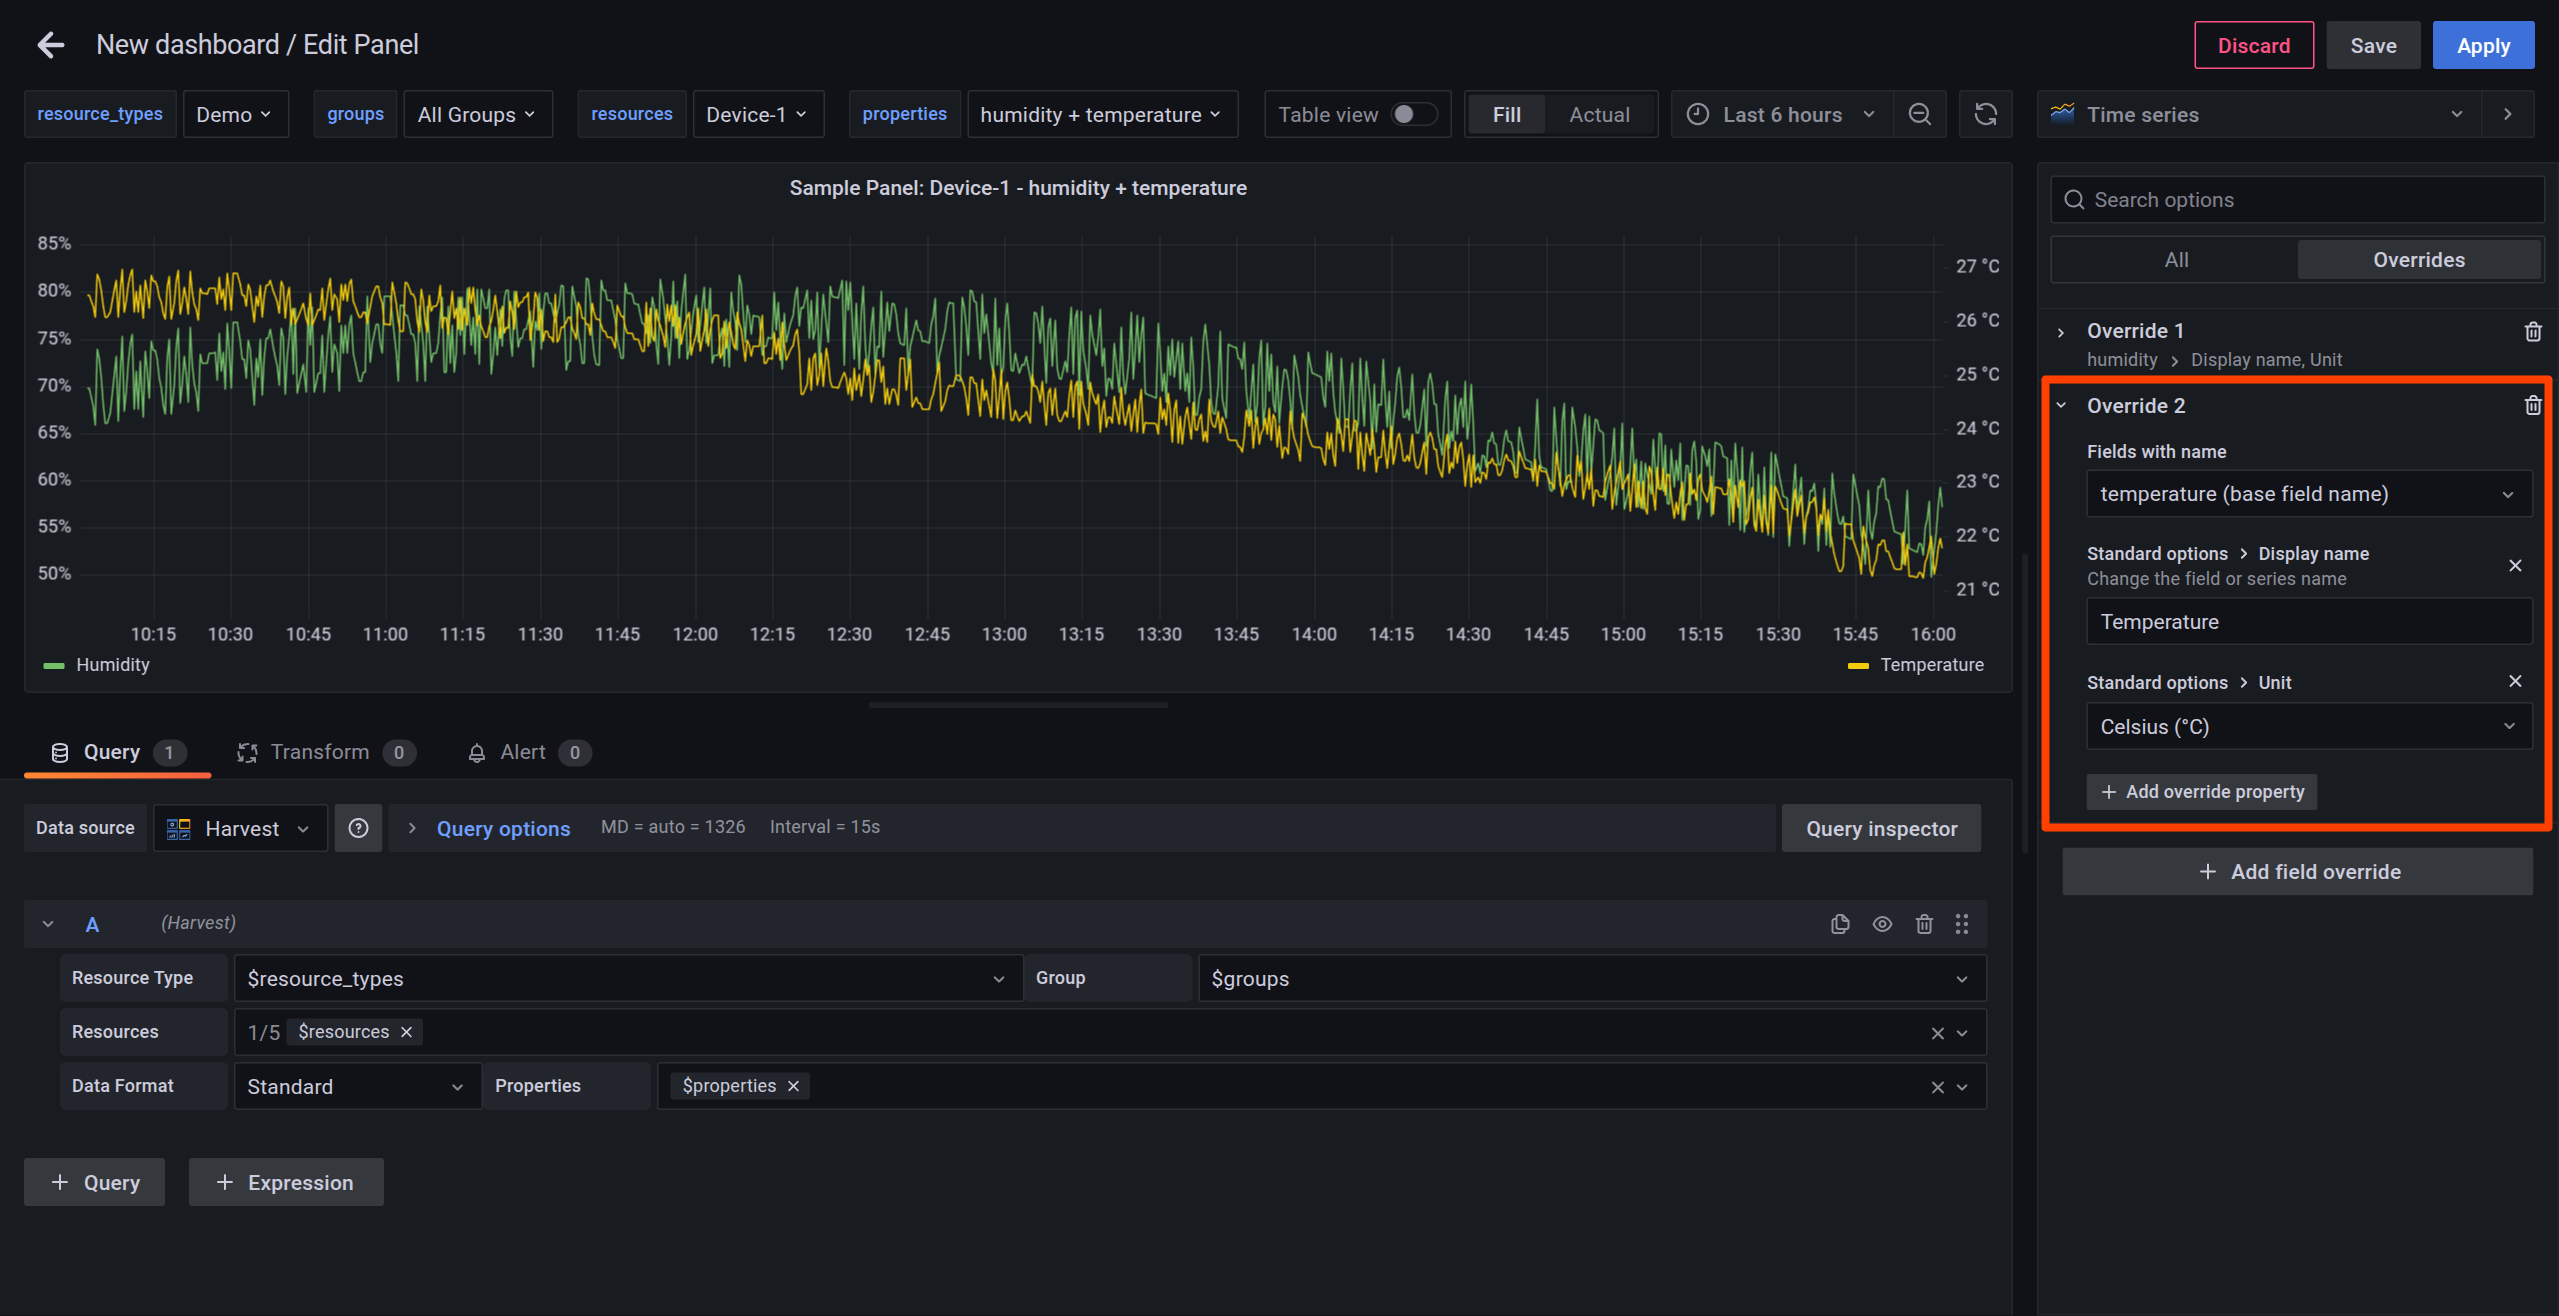
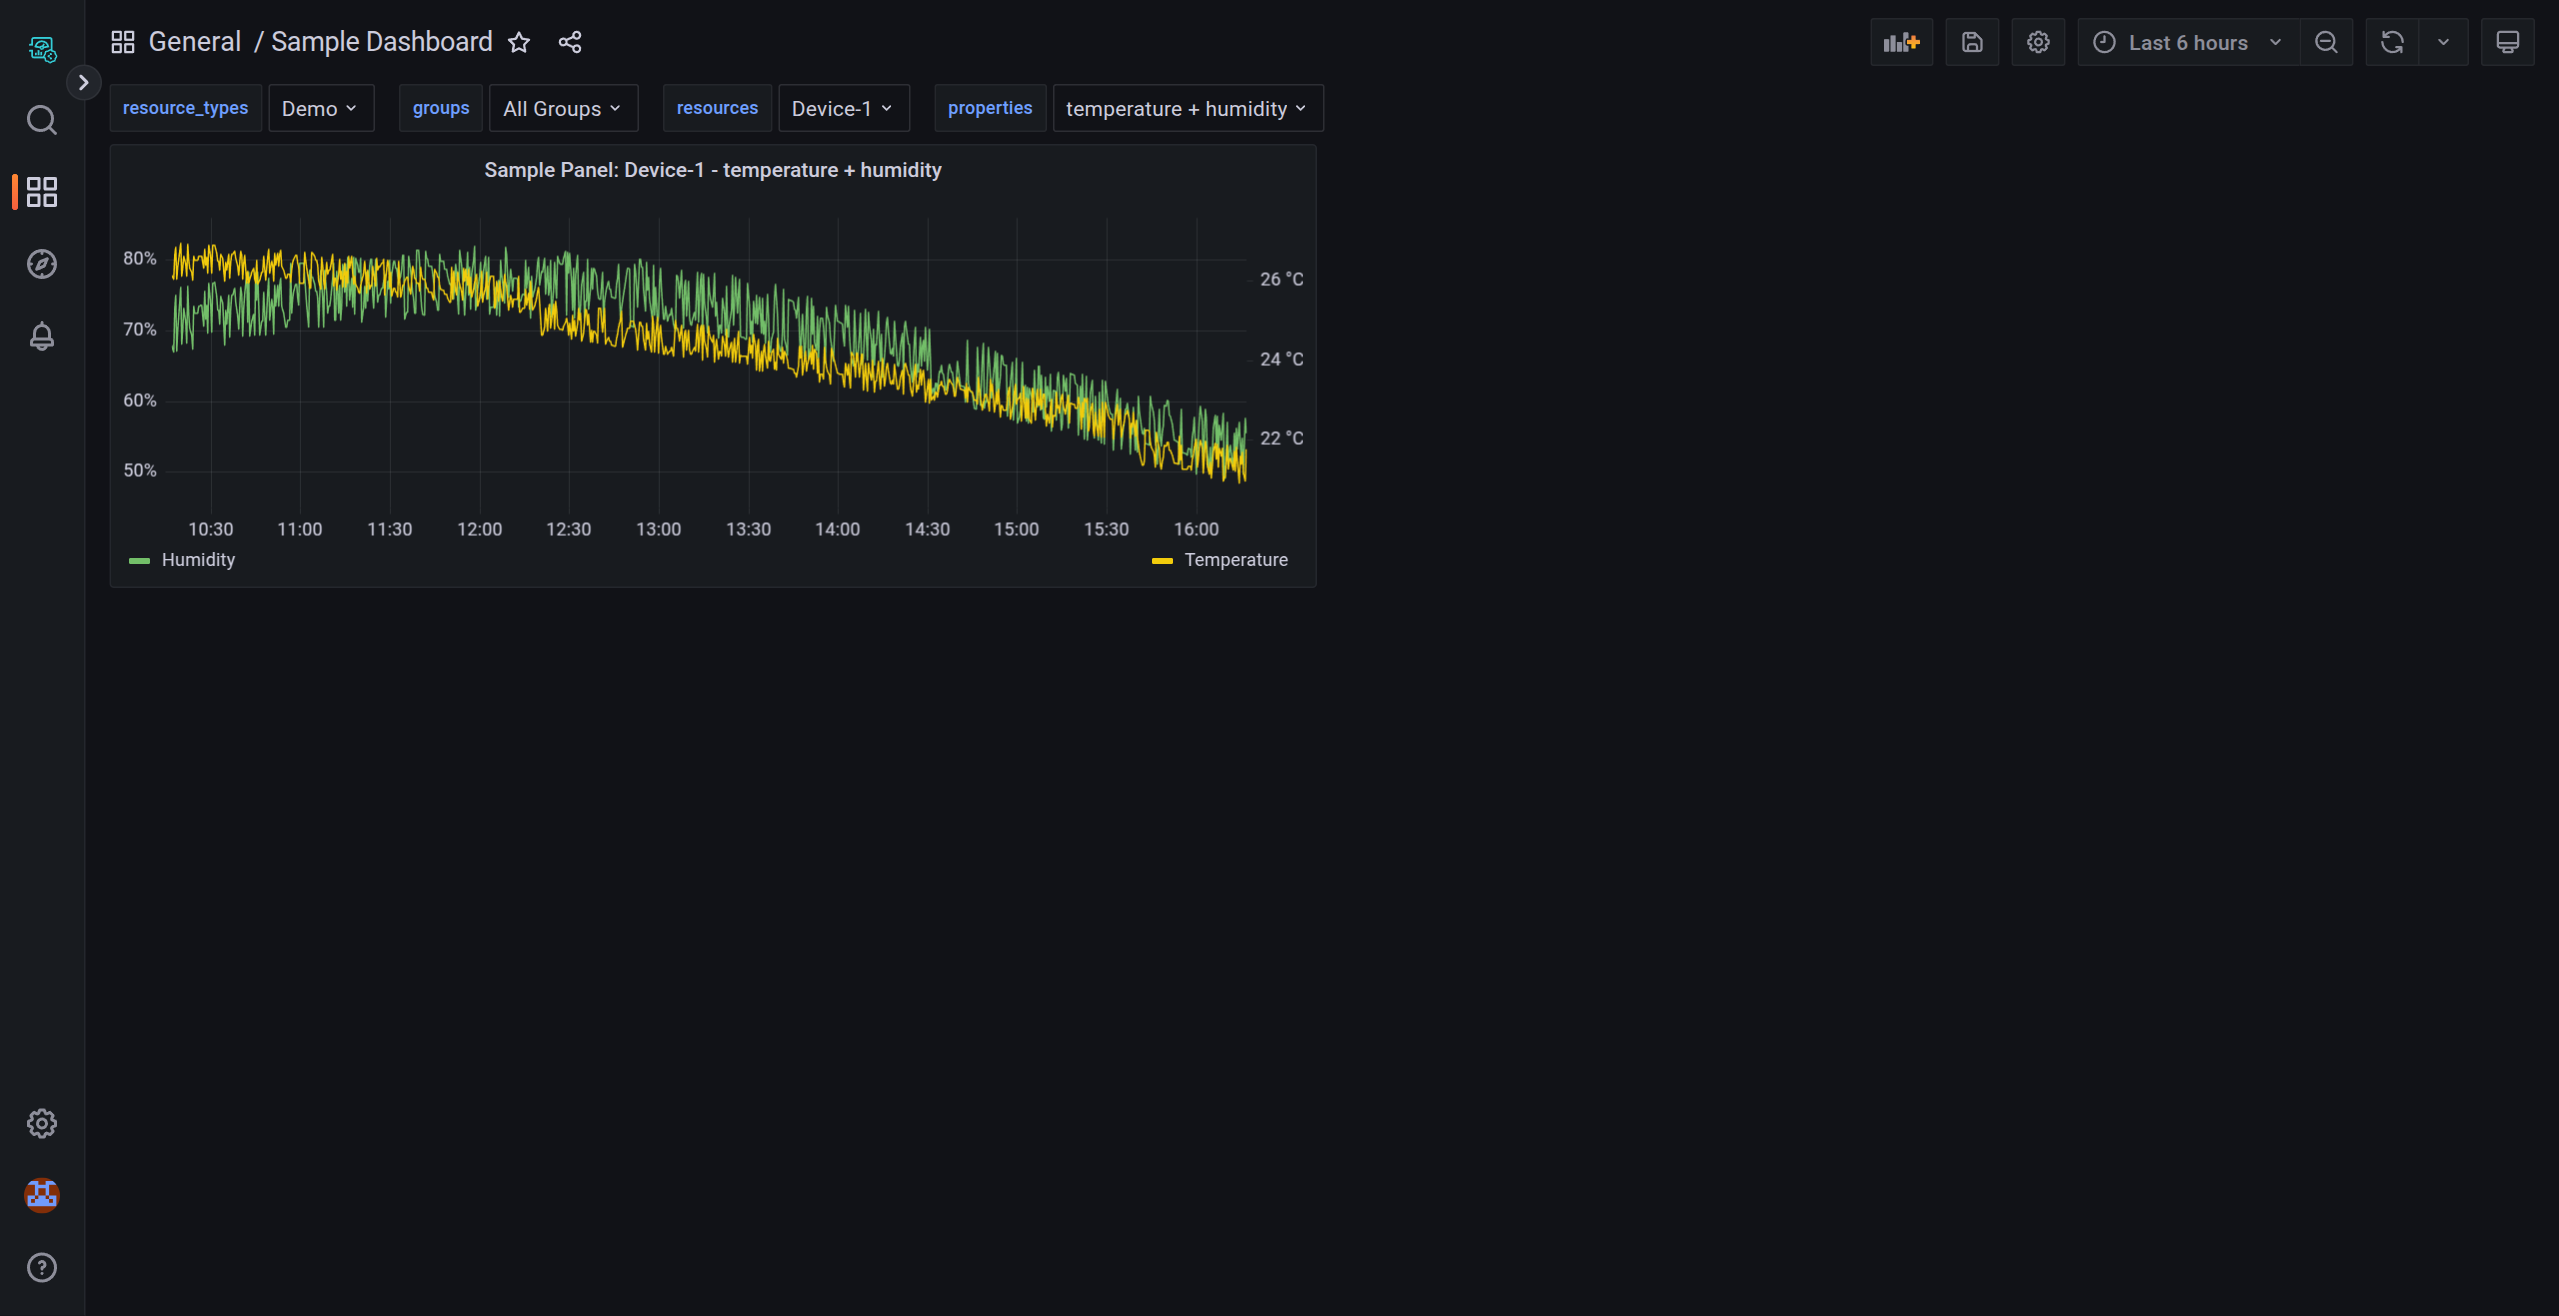
The temperature graph changes to display °C.
Since the units are different for both axes, the graph is automatically changed to a dual-axis graph.
Save the Dashboard
-
Click the Apply button on the Edit Panel screen.
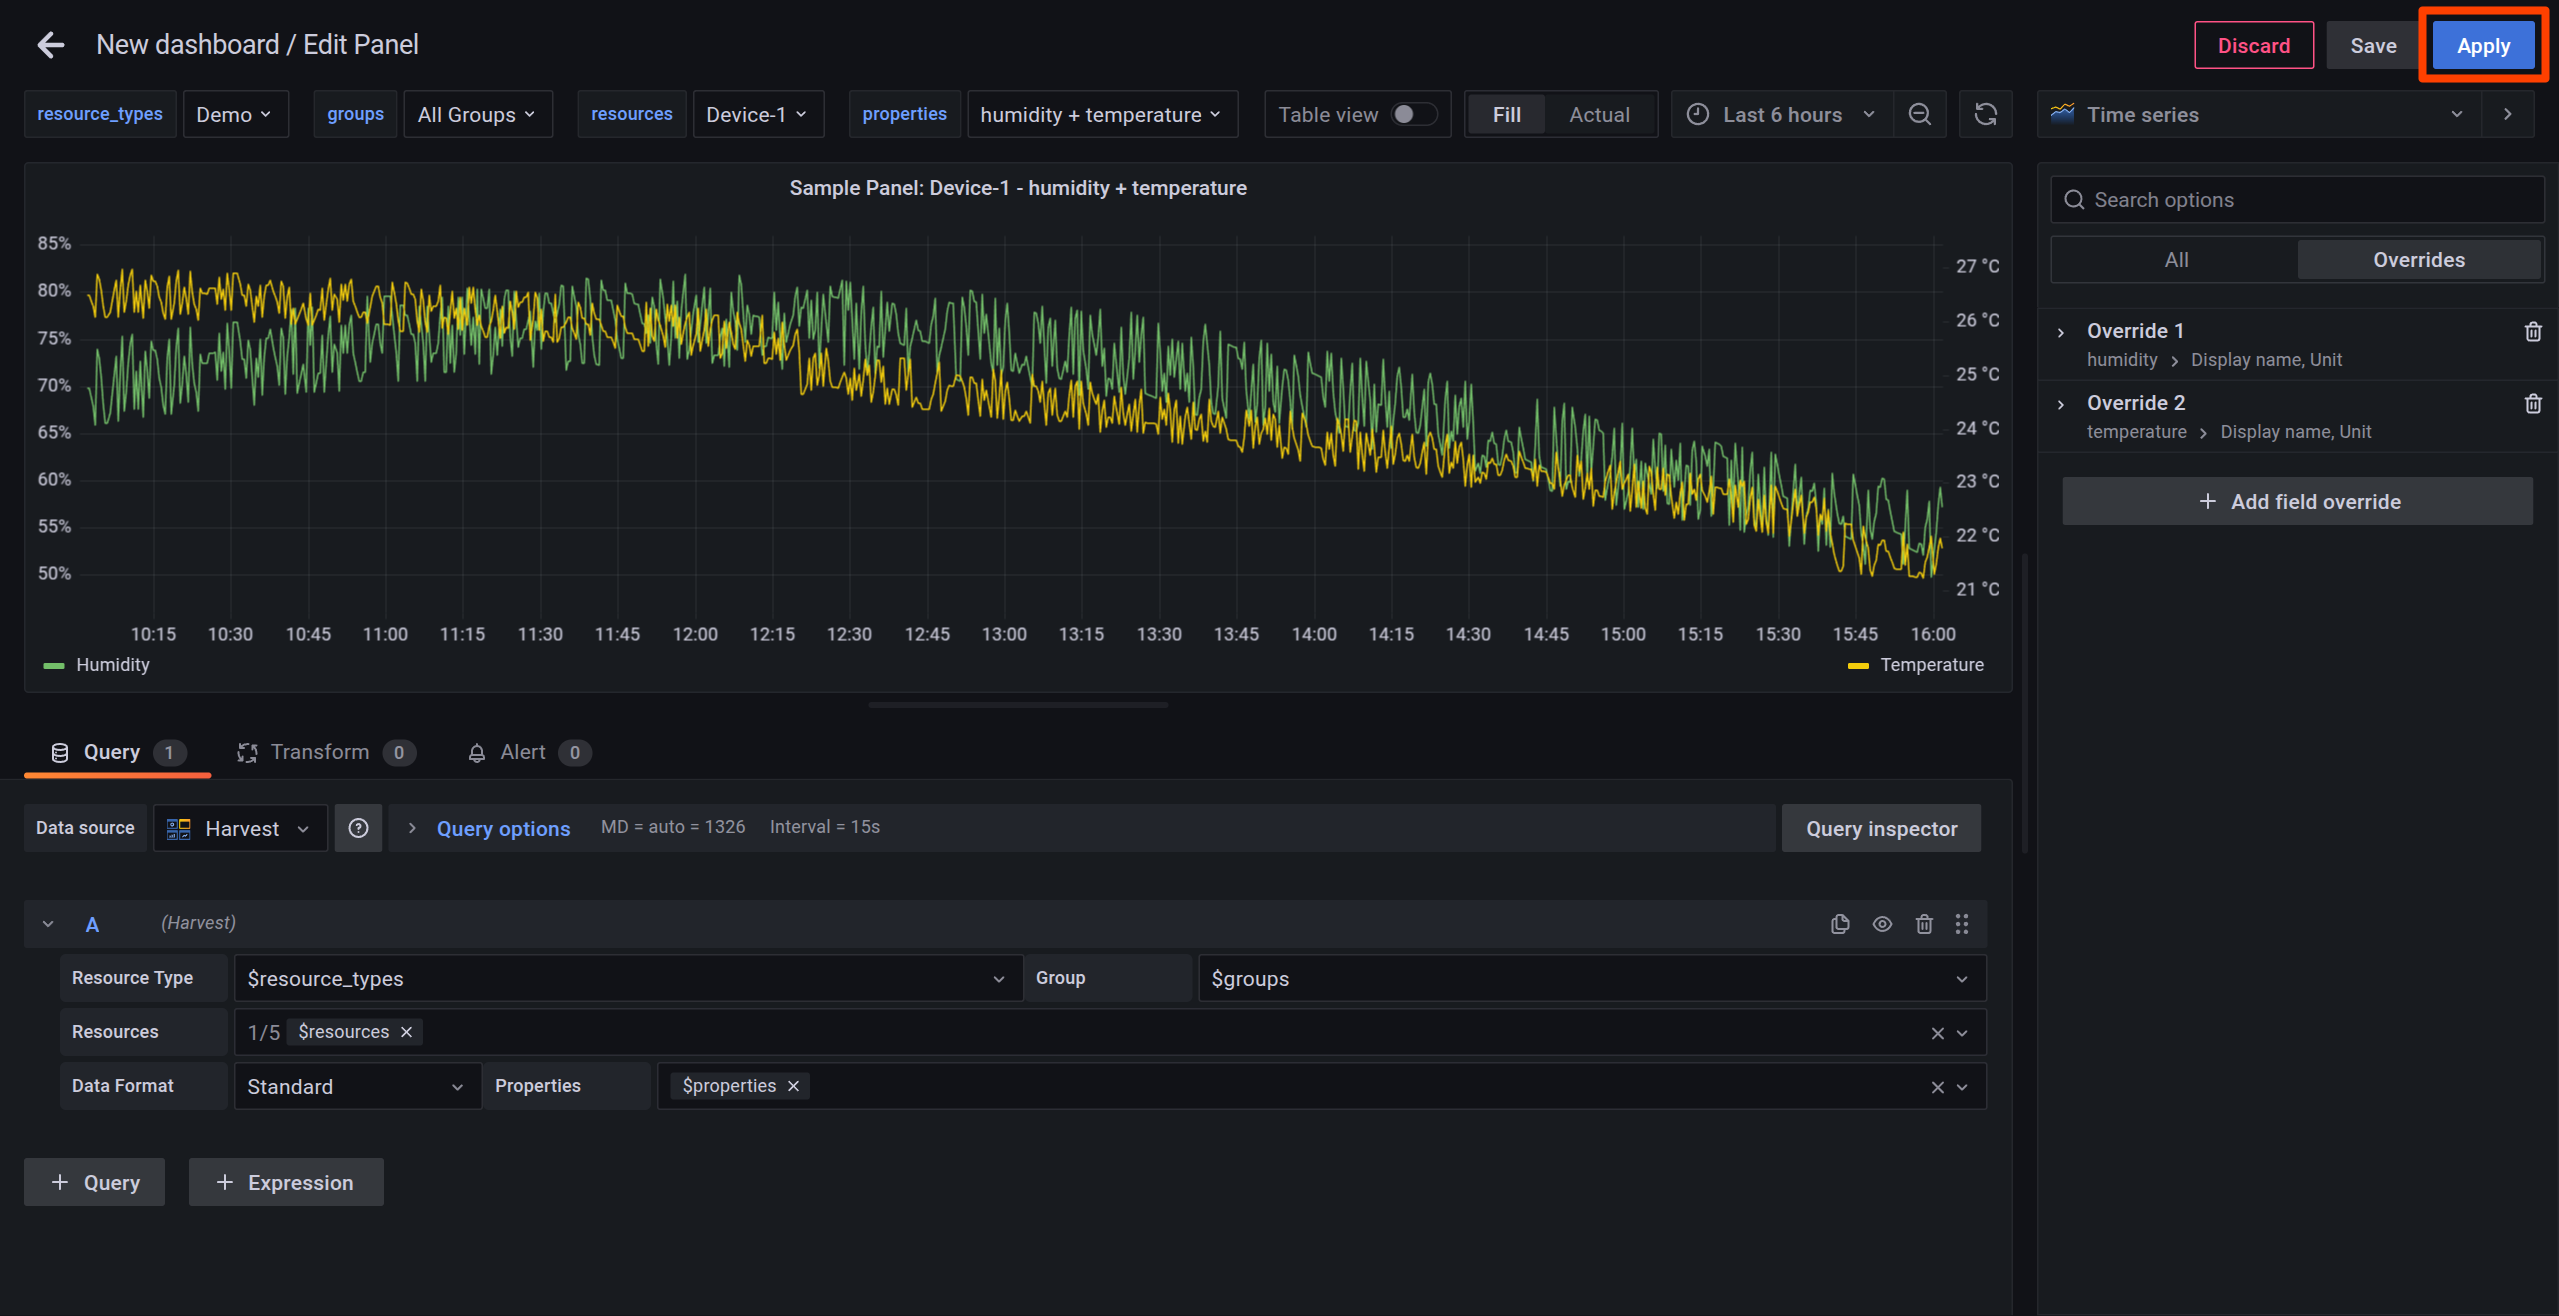
The Panel is saved and you are returned to the Dashboard screen.
-
Click Save dashboard, enter
Sample Dashboardas the Dashboard name and click the Save button.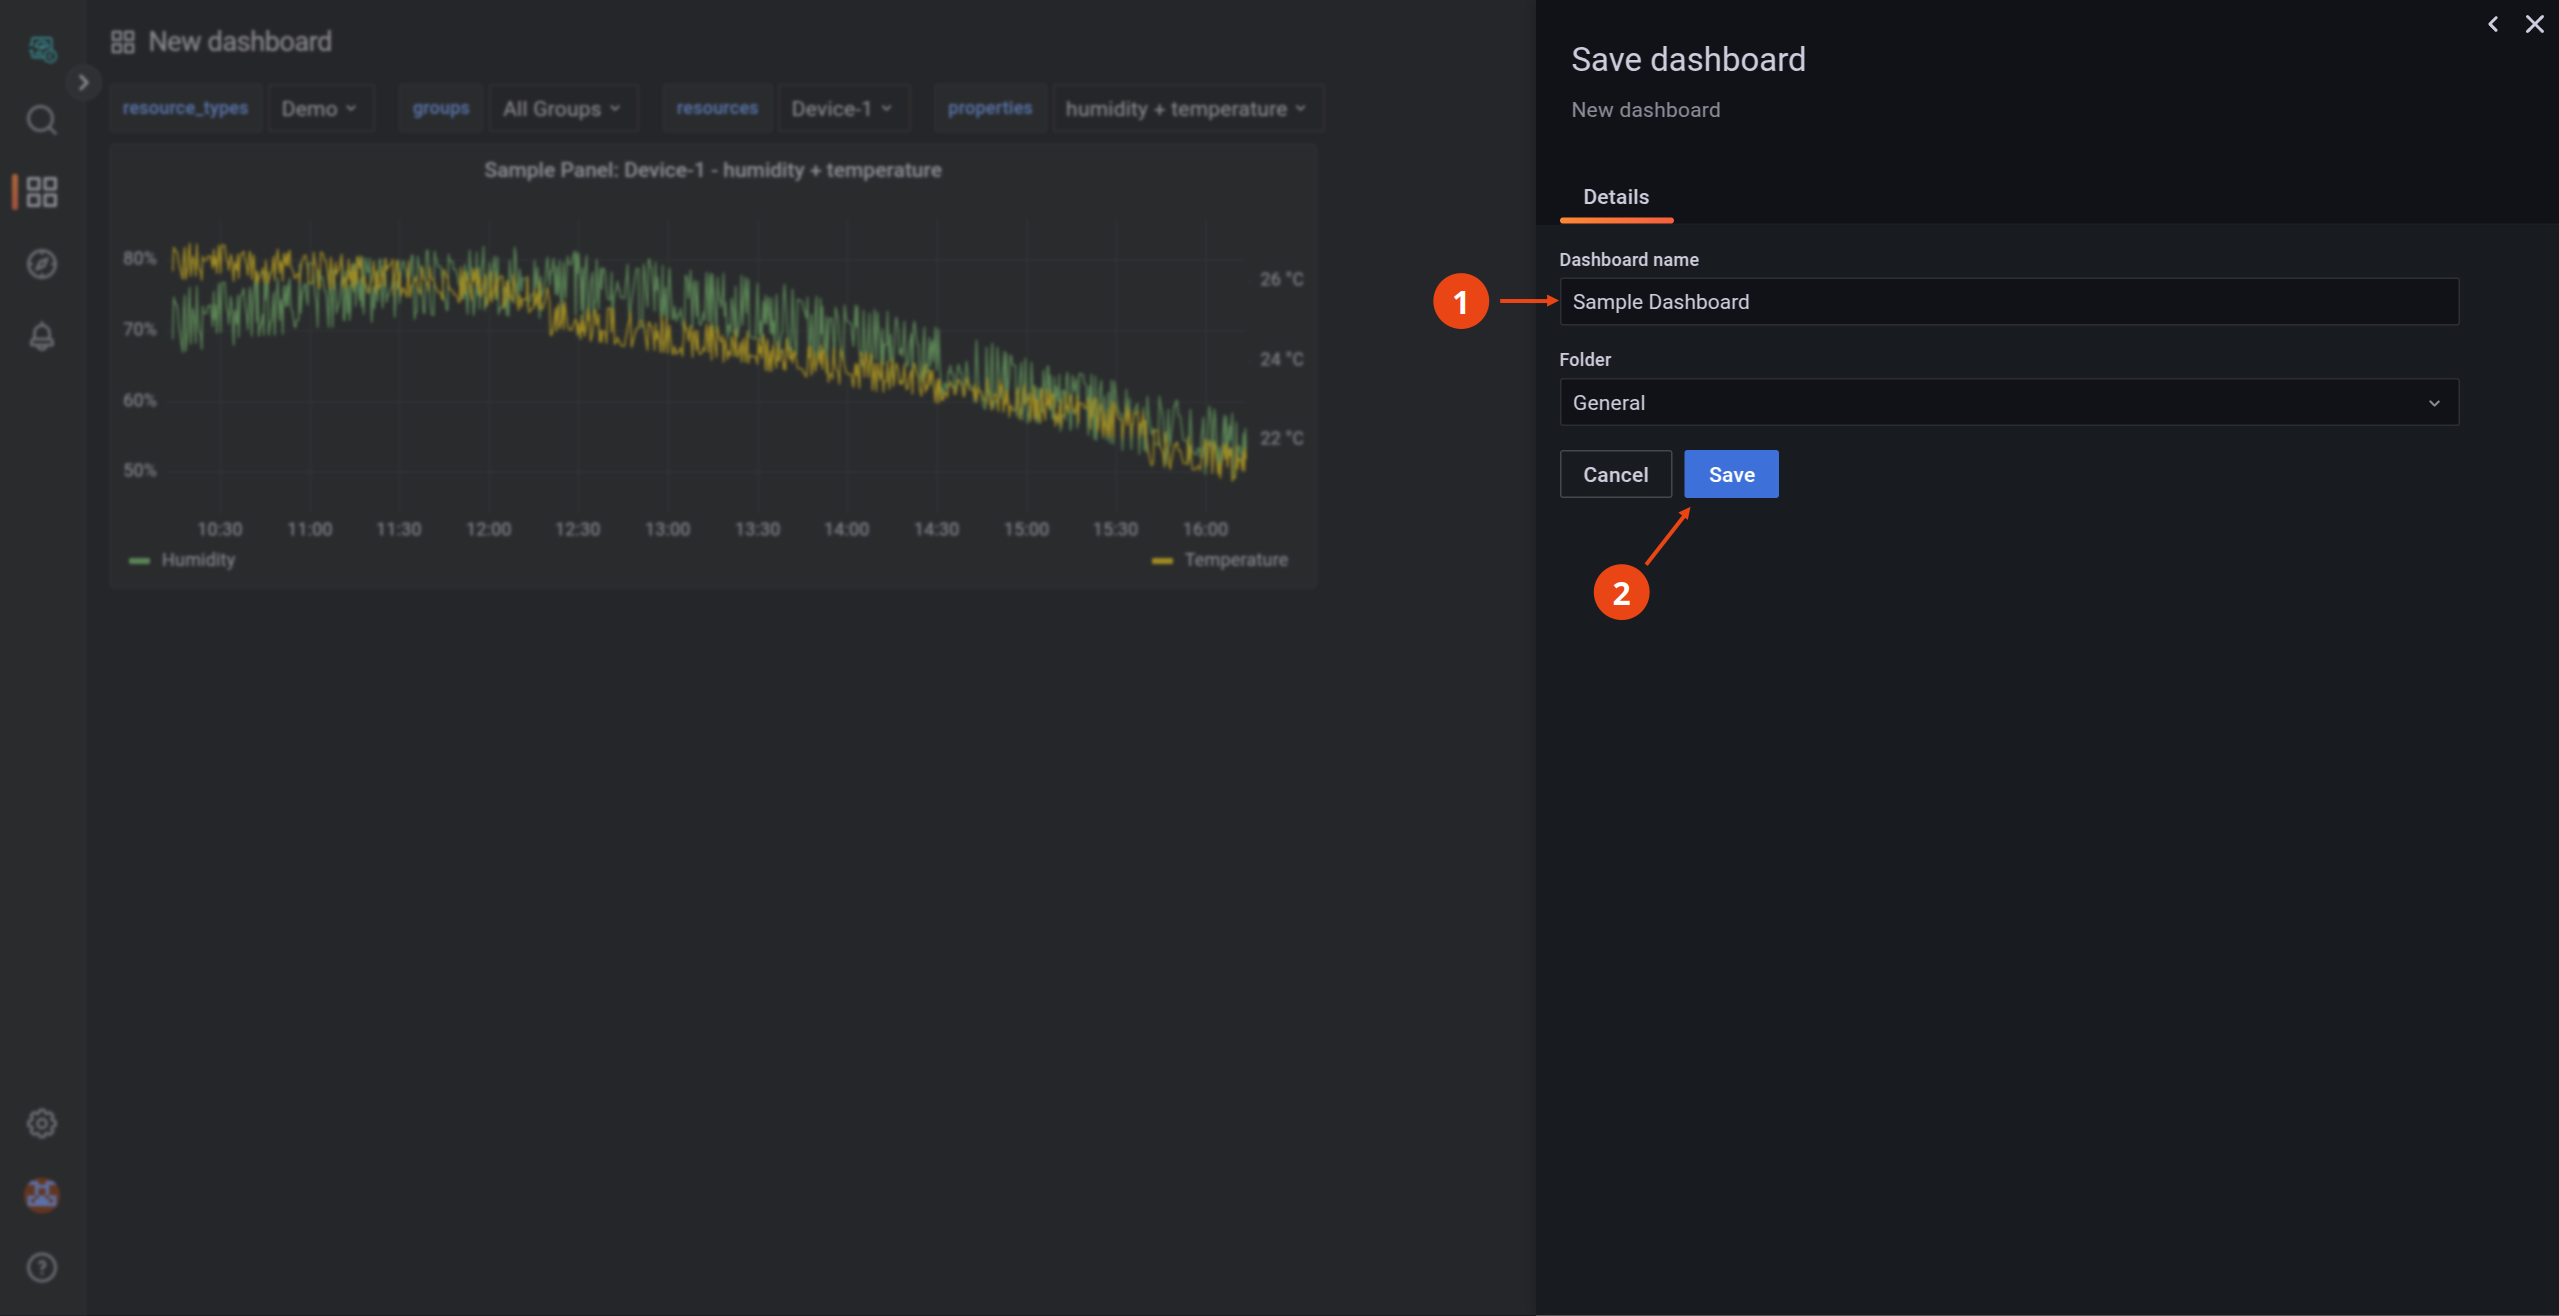
The Dashboard is saved and you are returned to the Sample Dashboard screen.
This concludes the creation of our sample dashboard. You can view and modify this dashboard at any time from the Dashboards page when signing in to the Lagoon Console.