Using Query to Display Data
Overview
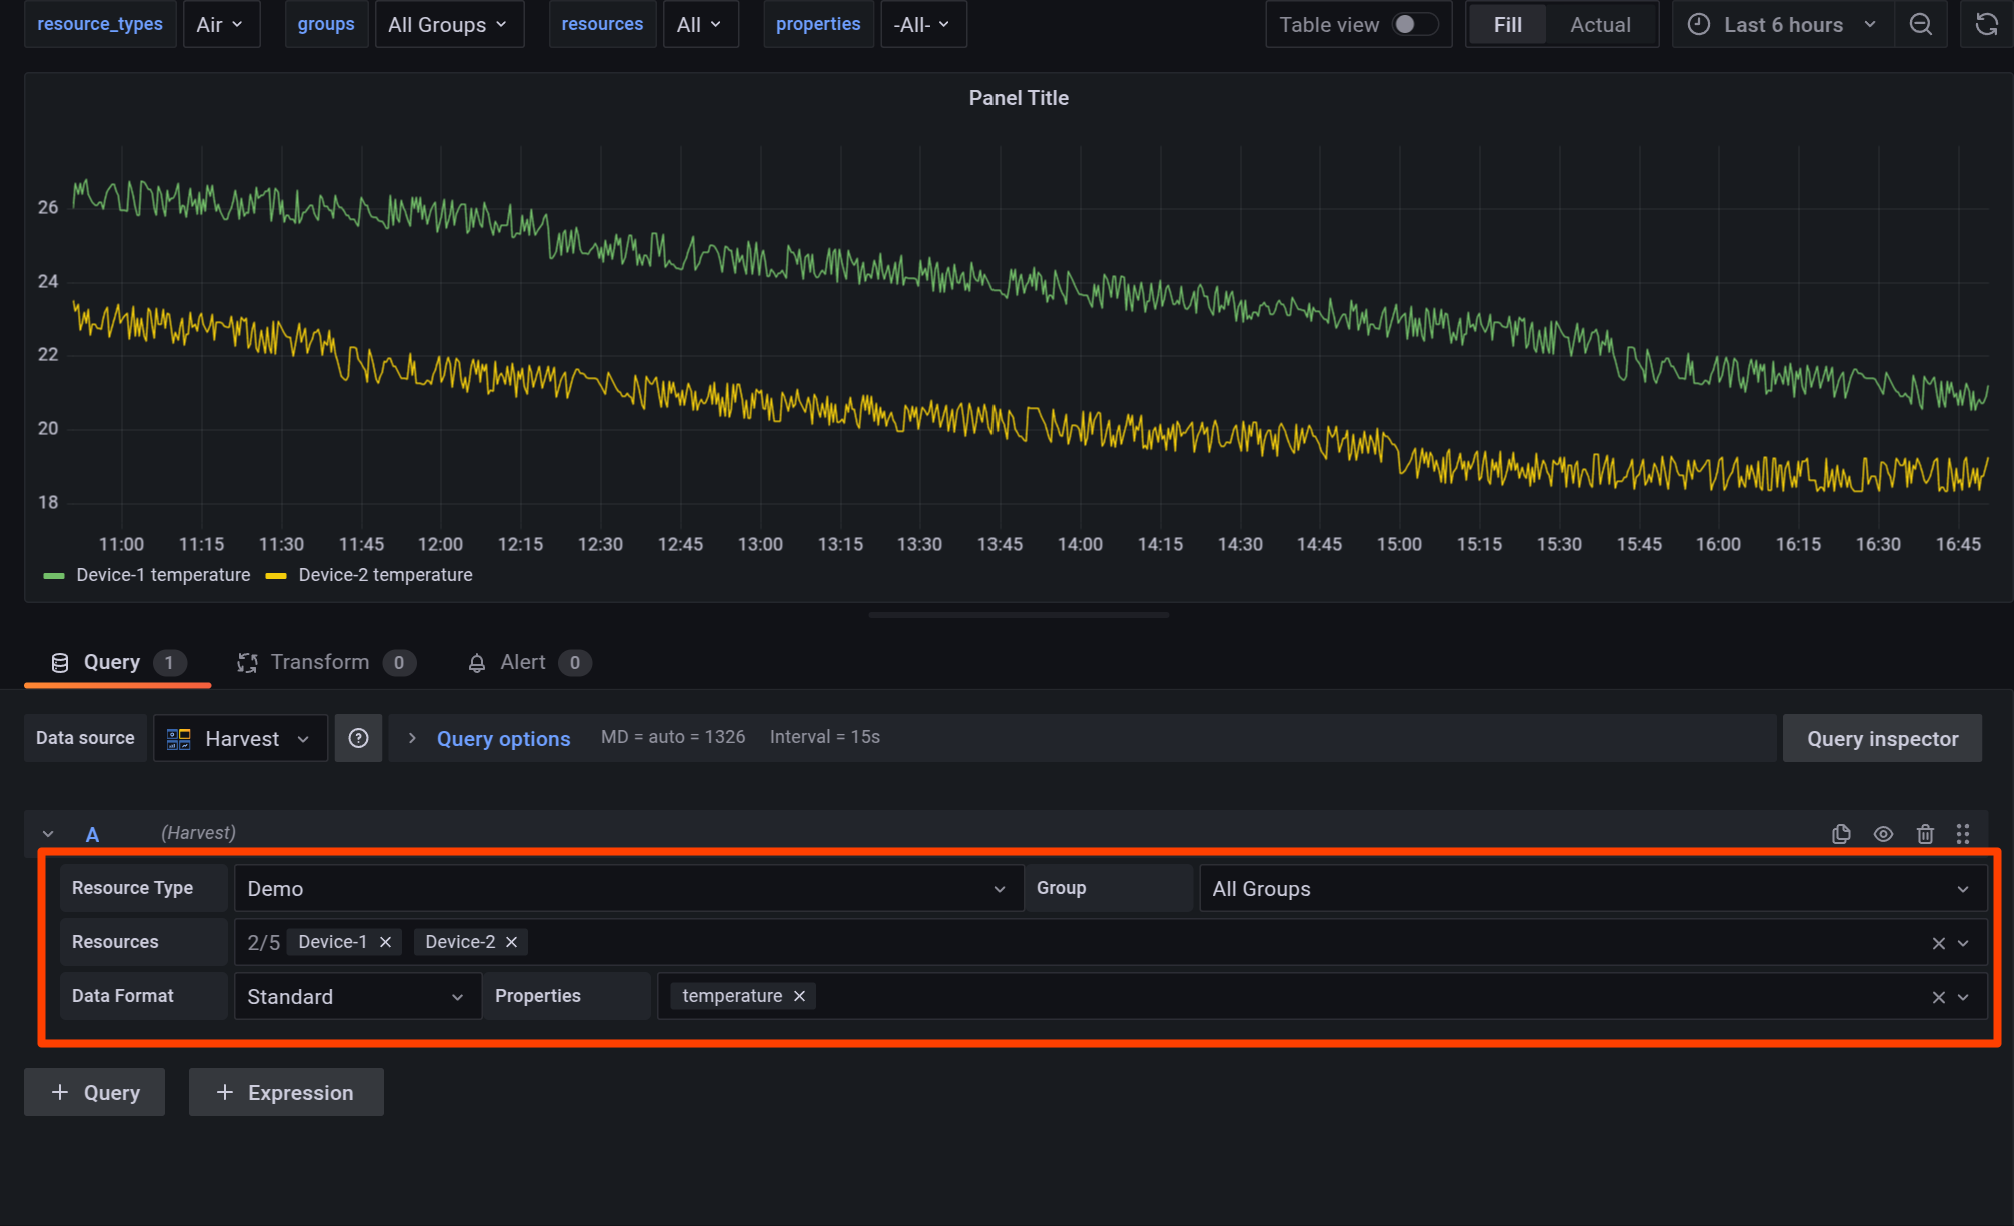
The Query Editor in the Panel Editor governs the data that is displayed. It is located below the panel display, in the Explore menu, and in the Alert editor. You can use Soracom Harvest Data and Soracom Query as data sources for analysis.
Configuring Soracom Harvest Data Options
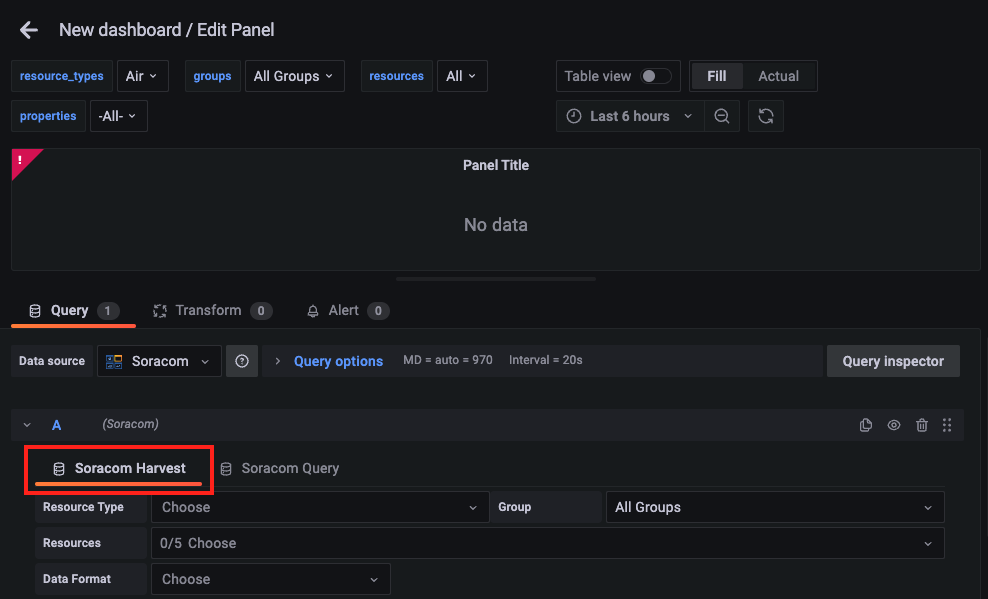
Select the Soracom Harvest tab.
Resource Type
The Resource type dropdown, located on the left, filters the resource list by type.
Resource types include Air, Sigfox, Device, and Demo.
If you configure variables for the dashboard, you can set variables as the Resource type. Newly created dashboards provide a built-in $resource_types variable which can be selected in the Resource type dropdown list.
Group
The Group dropdown filters the resource list by group.
When set to All Groups, all resources corresponding to the selected Resource type will be displayed.
Group here refers to the groups you have created in the Soracom User Console. Refer to Creating a Group for more information on creating groups.
If you configure variables for the dashboard, you can set variables as Groups. Newly created dashboards provide a built-in $groups variable which can be selected in the Group dropdown list.
Resources
The Resources dropdown supports multi-select and is used to select the target resources to display in the panel.
Resources that have sent data to Soracom Harvest Data at least once and match the selected Resource type are displayed.
To clear selections, click the next to a resource name or the on the right of the dropdown bar to remove all selections.
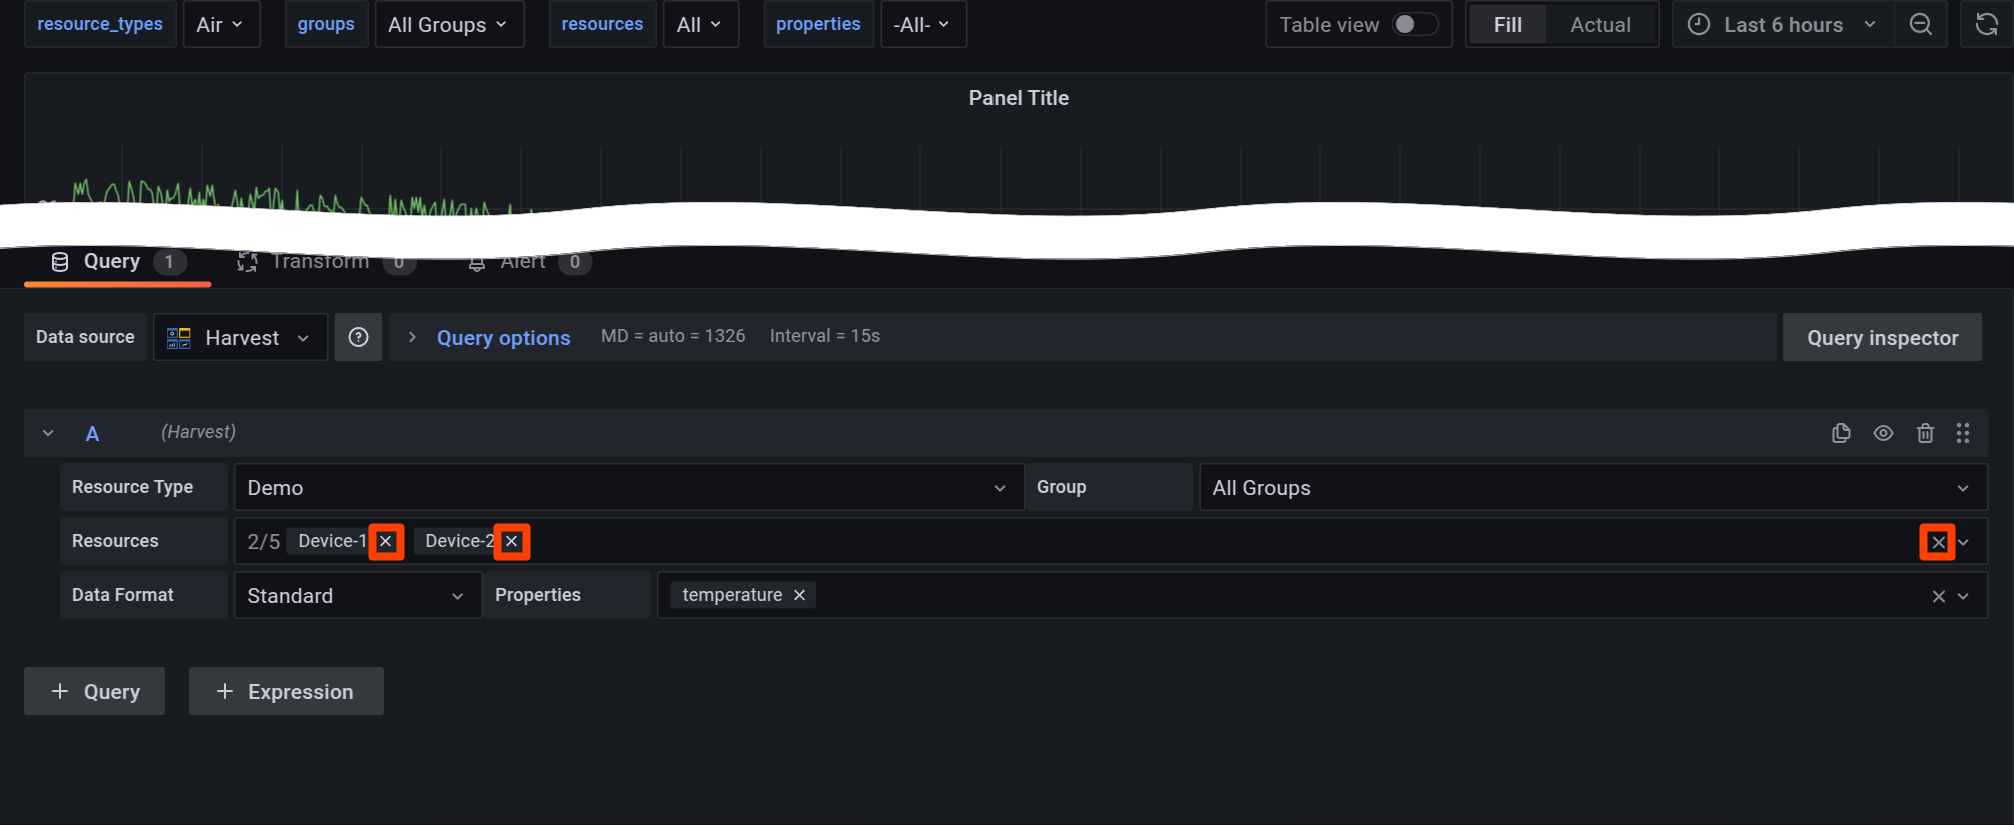
You can select up to five resources to display on the panel.
The Demo resource type provides five resources for experimenting with various Soracom Lagoon features, labeled Device-1 through Device-5.
If you configure variables for the dashboard, you can set variables as Resources. Newly created dashboards provide a built in $resources variable which can be selected in the Resources dropdown list.
Multi-resource selection is not supported by some panel types. Certain panel types require separate queries for multi-resource plotting:
- Time series
- Bar chart
- Stat
- Gauge
- Bar Gauge
- Table
- Pie Chart
- State Timeline
- Heatmap
- Status History
- Histogram
Data Format
The Data format dropdown is used to modify the format of the data to improve compatibility with certain panels. The three available options are Standard, Table, and Map.
- Standard
- The Standard format is broadly compatible with most panels and should be used in most cases.
- Table
- The Table format is deprecated and should not be used for new dashboards.
- Map
- The Map format is used to indicate which data series correspond to the
latitudeandlongitudeproperties required by the Soracom Map Panel.
- The Map format is used to indicate which data series correspond to the
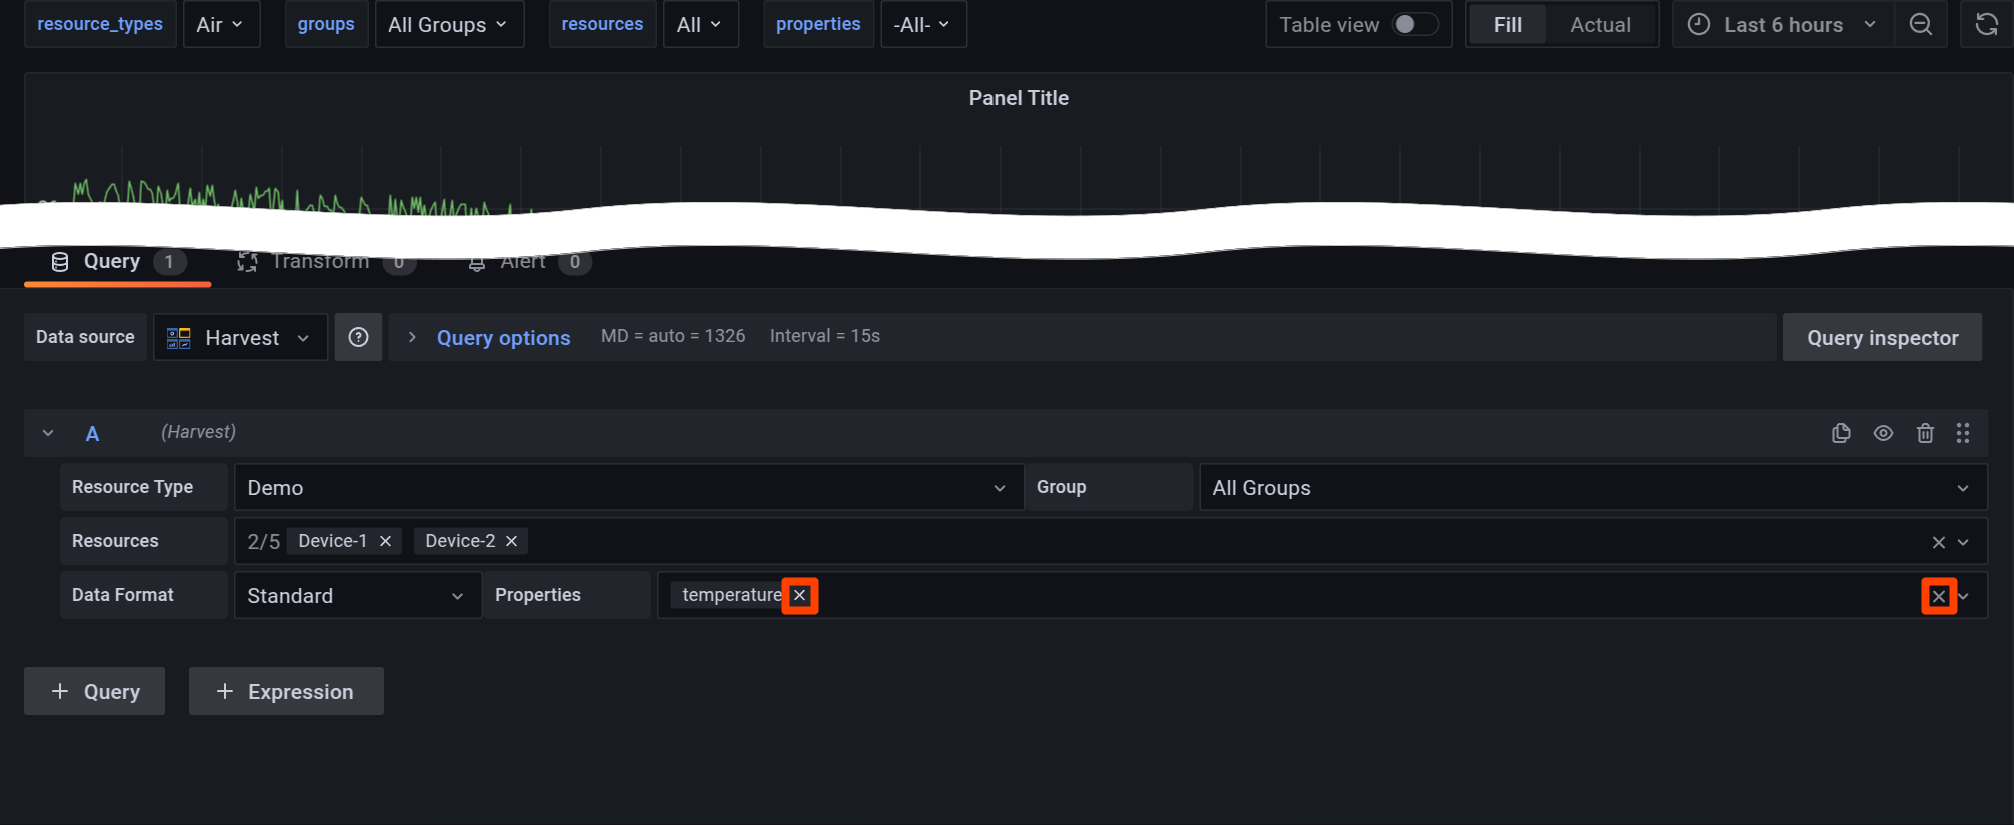
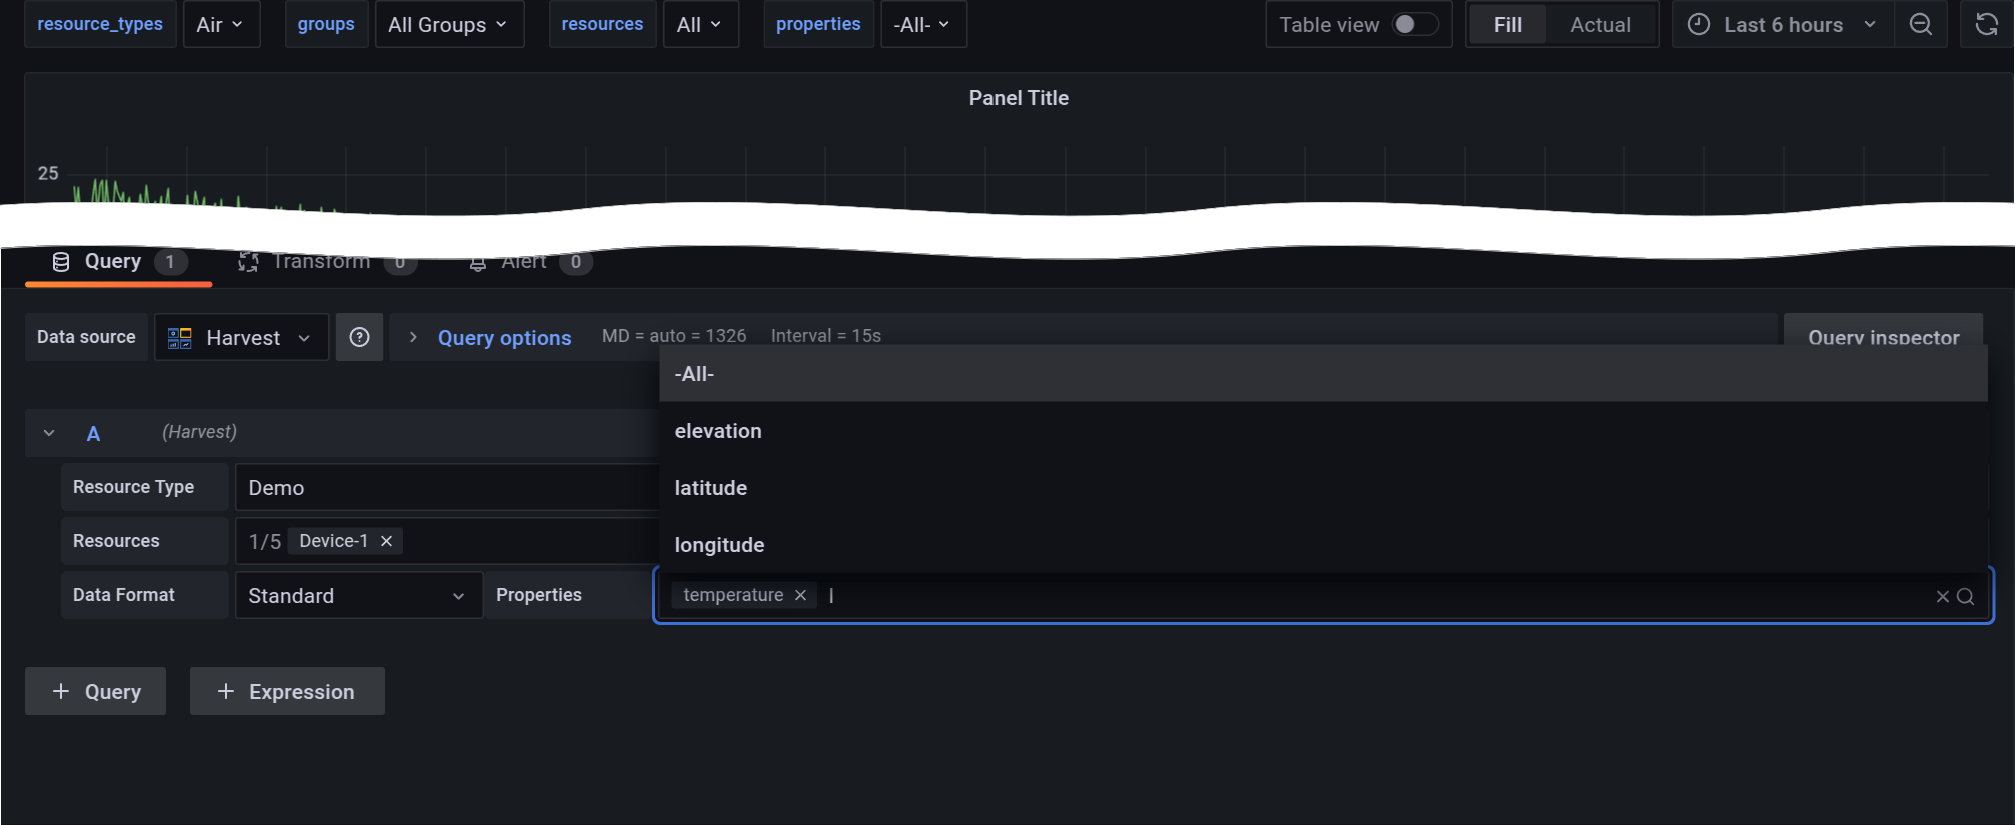
Properties
The Properties dropdown supports multi-select and filters the type of data displayed on the panel by name. Available properties are based on the data sent by the selected Resources.
When set to -All-, all data sent by the selected resources will be displayed.
To clear selections, click the next to a resource name or the on the right of the dropdown bar to remove all selections.
If you configure variables for the dashboard, you can set variables as Properties. Newly created dashboards provide a built in $properties variable which can be selected in the Properties dropdown list.
Searching with Configuration Options
The dropdowns in the Query Editor can be searched by typing the first few letters of the desired value. The options shown in the dropdown will be filtered based on the search term.
See examples below with the Resources and Properties dropdowns set to All.
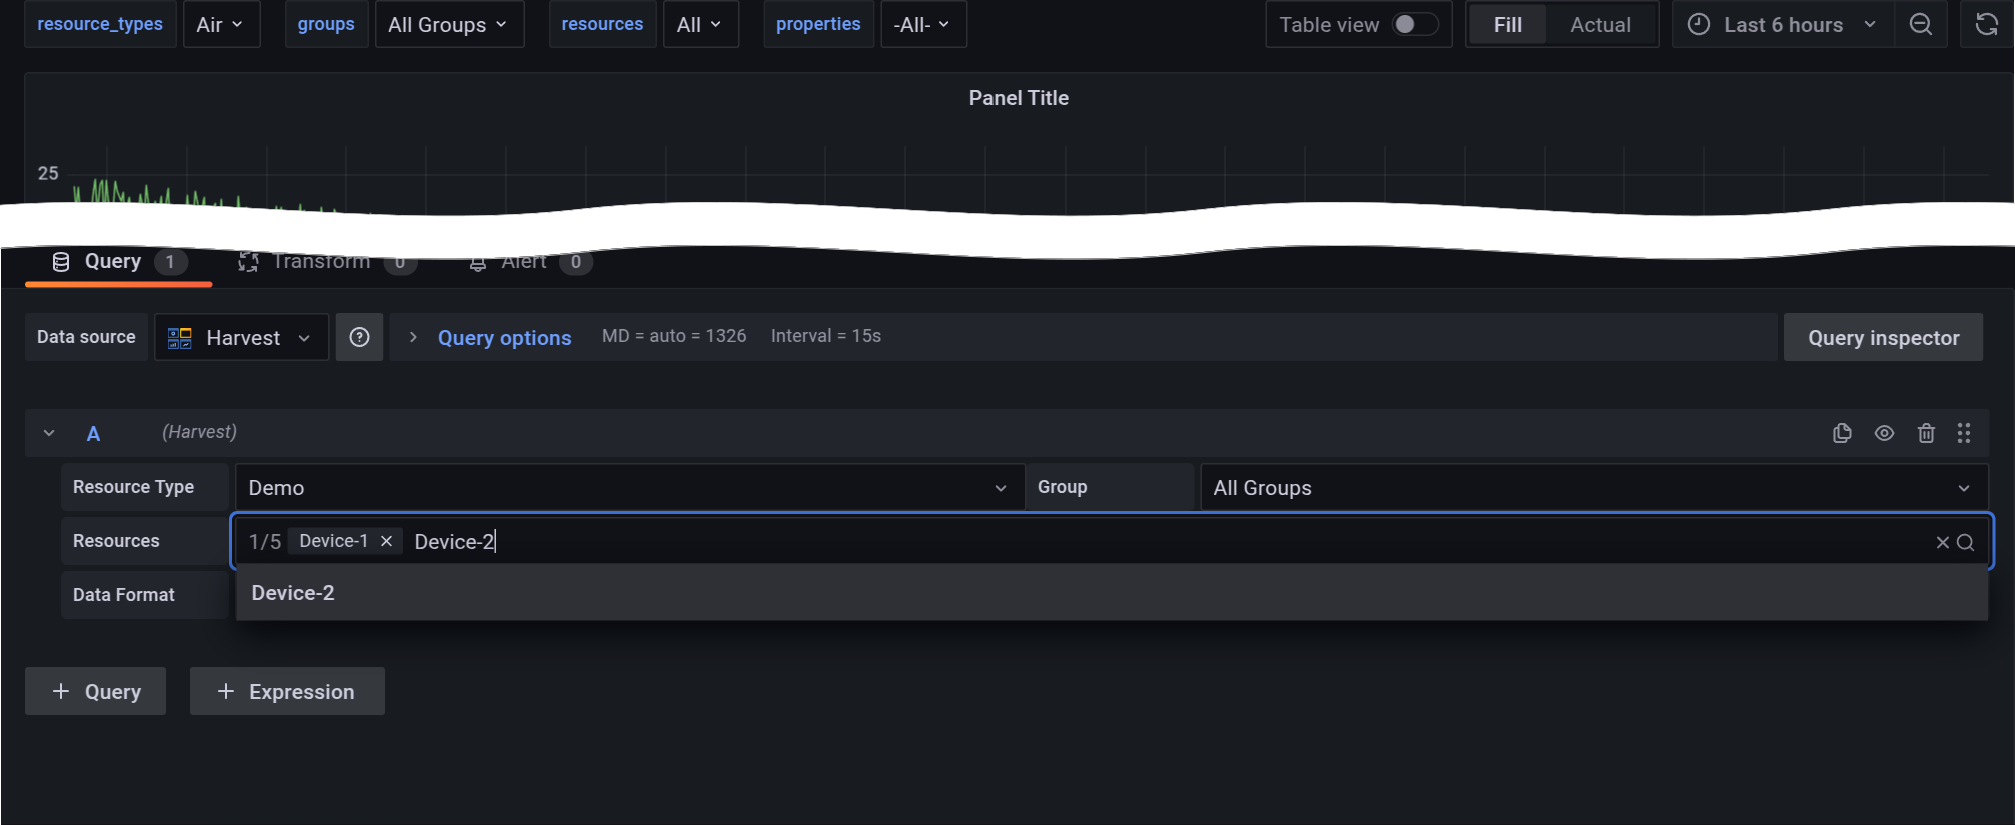
After choosing the desired option from the returned search results, it can be selected by pressing Enter or clicking on the option. If you accidentally select the wrong option, you can clear the selection by pressing Backspace.
Configuring Soracom Query Options
Select the Soracom Query tab.
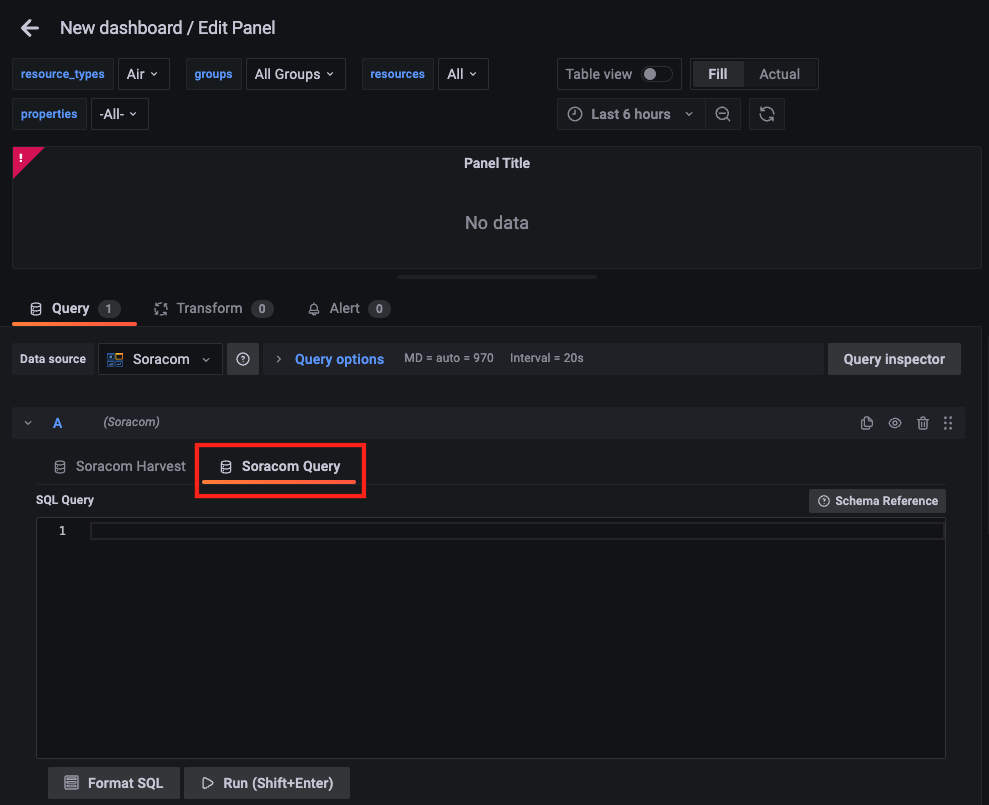
SQL Query
Enter the SQL query to execute.
- Clicking the Format SQL button will format the SQL query you've entered.
- Clicking the Schema Reference button will display the tables in the database, along with what items (columns) are included in each table and their respective formats (data types).
- Clicking the Run (Shift+Enter) button will execute the SQL query. As indicated on the button, you can also execute the query by pressing the Shift key and Enter key simultaneously.
API calls for Soracom Query are counted
When executing Soracom Query from Soracom Lagoon, the number of API calls to Soracom Query are counted towards the total. Some Soracom Query plans have a limit on the number of API calls, or incur fees based on the number of API calls executed. For further details, refer to View Usage
Note that the time range specified in your SQL query, may be limited by time range set in the panel
The time range of data that can be retrieved by your SQL query is governed by the time range set in the panel.
Example: If the SQL query is written to retrieve values for the past 2 hours, but the time range in the panel is set to 1 hour, only values for 1 hour will be retrieved.
The User Console's SQL Assistant makes creating SQL queries much easier. For detailed steps, refer to Show Connection Trends using Query.