Using Variables to Switch Data Displayed in the Panel
Overview
By default, a panel can display data from only one device. Creating separate panels for each device can quickly consume screen space and require significant effort. To address this, variables allow dynamic data visualization.
With Variables, you can achieve:
- Switching devices or series displayed in a panel.
- Repeatedly displaying series in the same format within a panel.
- Repeatedly displaying panels in the same format within a dashboard.
- Repeatedly displaying rows in the same format within a dashboard.
Dashboards with Variables cannot be shared with third parties. Avoid using Variables in dashboards intended for sharing with third parties.
This page explains features commonly used in Lagoon. For additional features, refer to the Variables documentation in Grafana.
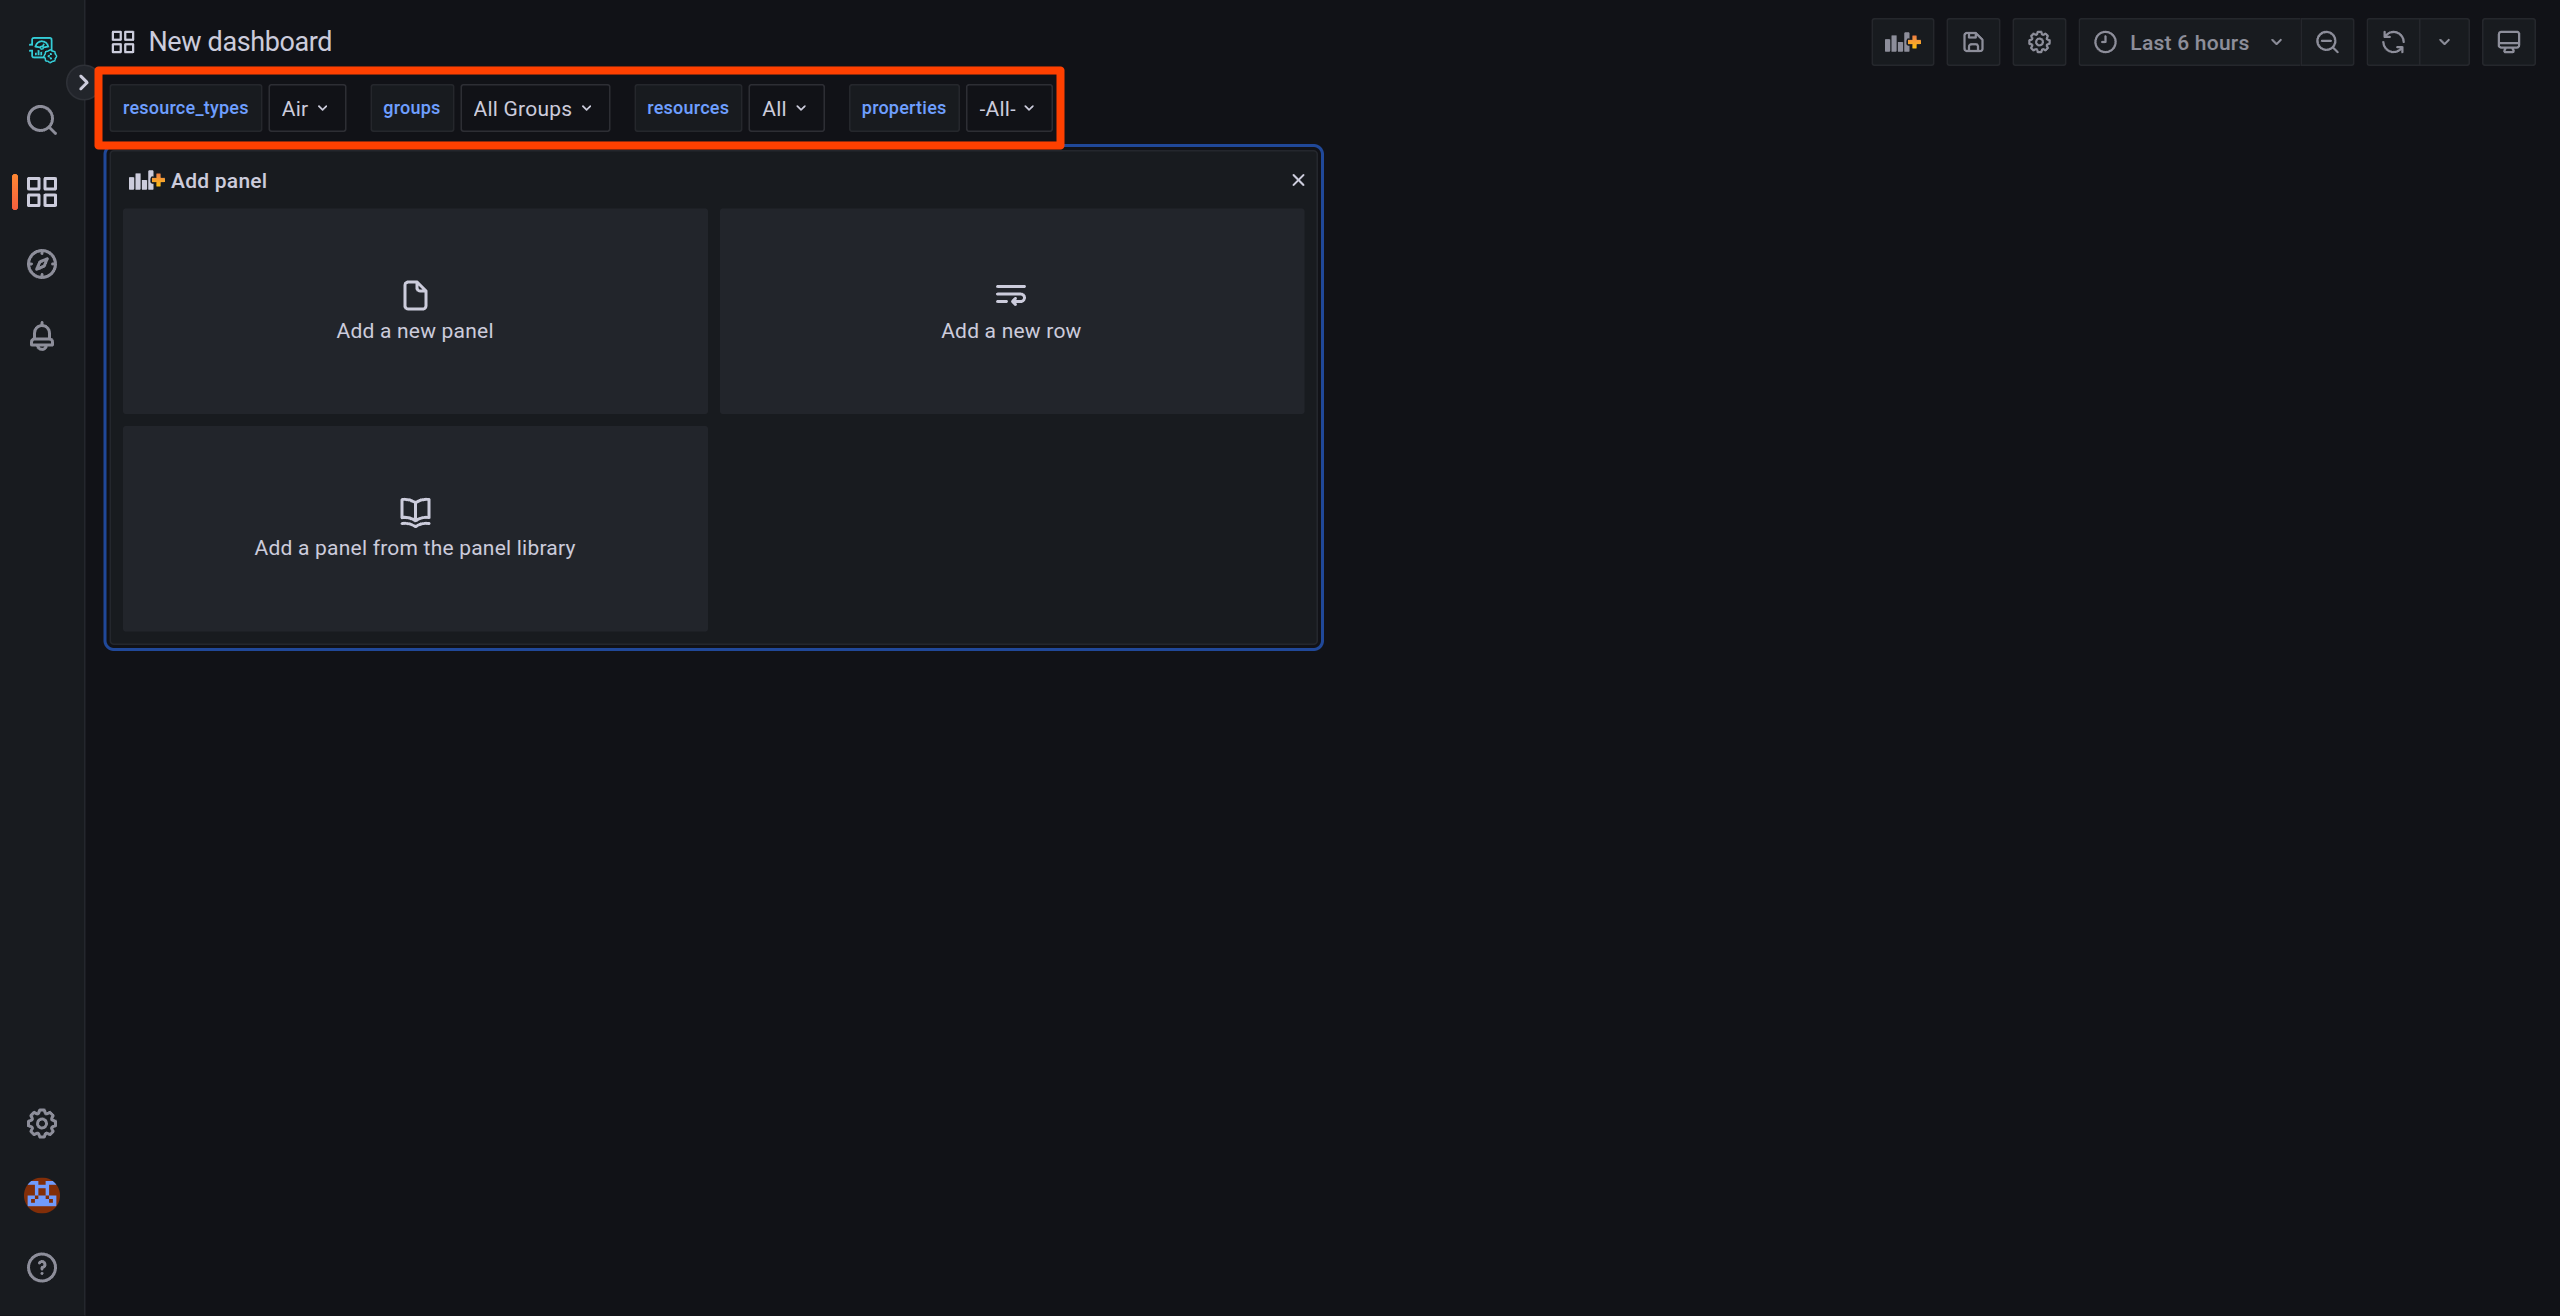
Default Variables
Soracom Lagoon inserts the following default variables into newly created dashboards:
- $resource_types: Select the resource type to display.
- $groups: Select the group to display.
- $resources: Select the resource to display.
- $properties: Select the property to display.
These variables must be deleted before sharing dashboards with third parties. Public dashboards do not support variables.
Global Variables
Soracom Lagoon also supports the global variables provided by Grafana. For more information, refer to the Grafana documentation on Global Variables.
Variables Settings
In Dashboard settings > Variables, you can add, duplicate, or delete variables.
There are several variable types, but in Soracom Lagoon, three types are commonly used:
Common Parameters
General
- Name: The name of the variable. (Max. 50 characters)
- Label: Optional display name.
- Description: Displays when hovering over the label above the dashboard.
- Show on dashboard: Choose from
Label and value,Value, orNothing.
Even if you select Nothing, you can still change the Variable by adding var-{variable}={value} to the dashboard URL's query parameters.
Selection options
- Multi-value: Enables selecting multiple values simultaneously.
- Include All option: Adds an
Alloption to include all variable values.
Query
The Query variable type lets you create a variable representing a resource ID or name using a regular expression. For example, you can create variables that include the names of all IoT SIMs owned by an operator.
You can use the key of your data in Soracom Harvest Data as a variable, but you cannot use the value of your data as a variable.
Query options
- Data source: In Soracom Lagoon, only "Harvest" is supported as a data source.
-
Query: The type of values returned is controlled by the query. Currently there are four main queries supported by Soracom Lagoon:
- Resource types - by using the query
resource_typesthe variable will return the available resource types.Air,Sigfox,Device,Demo
- Groups - by using the query
groupsthe variable will return the available groups.- An
All Groupsoption is automatically included.
- An
-
Resources - by specifying one of the resource types, the variable will return the available resources of that type.
- For example,
demowill returnDevice-1,Device-2, etc.subscriberswill return the available SIMs. - The available resource type queries are listed below:
-
Resource Type Query String Air subscribersSigfox sigfox_devicesInventory Device devicesDemo demo - The resources turned by the query can be restricted to a group by providing the group ID as a query parameter. For example,
devices?group=deadbeef-ffff-ffff-ffff-ffffffffffff.
- For example,
- Properties - by specifying a resource type and a resource ID seperated by
||the variable will return the available properties of that resource.- For example,
demo||Device-1will returntemperature,humidity, etc. - For most Soracom resources, the resource name and ID are not the same. For example, the resource name for a SIM is the IMSI, but the resource ID is the SIM ID. To get the properties of a SIM, you must use the SIM ID as the resource ID. e.g.
subscribers||123451234512345 - An
-All-option is automatically included.As variables resolve to the ID of the selected value, it is possible to chain variables together, referencing another variable in the query. For example, to get the properties of a specific device, you can use the query
devices||$devices, where$devicesis another variable that contains a device ID. The built-in variables make extensive use of variable chaining.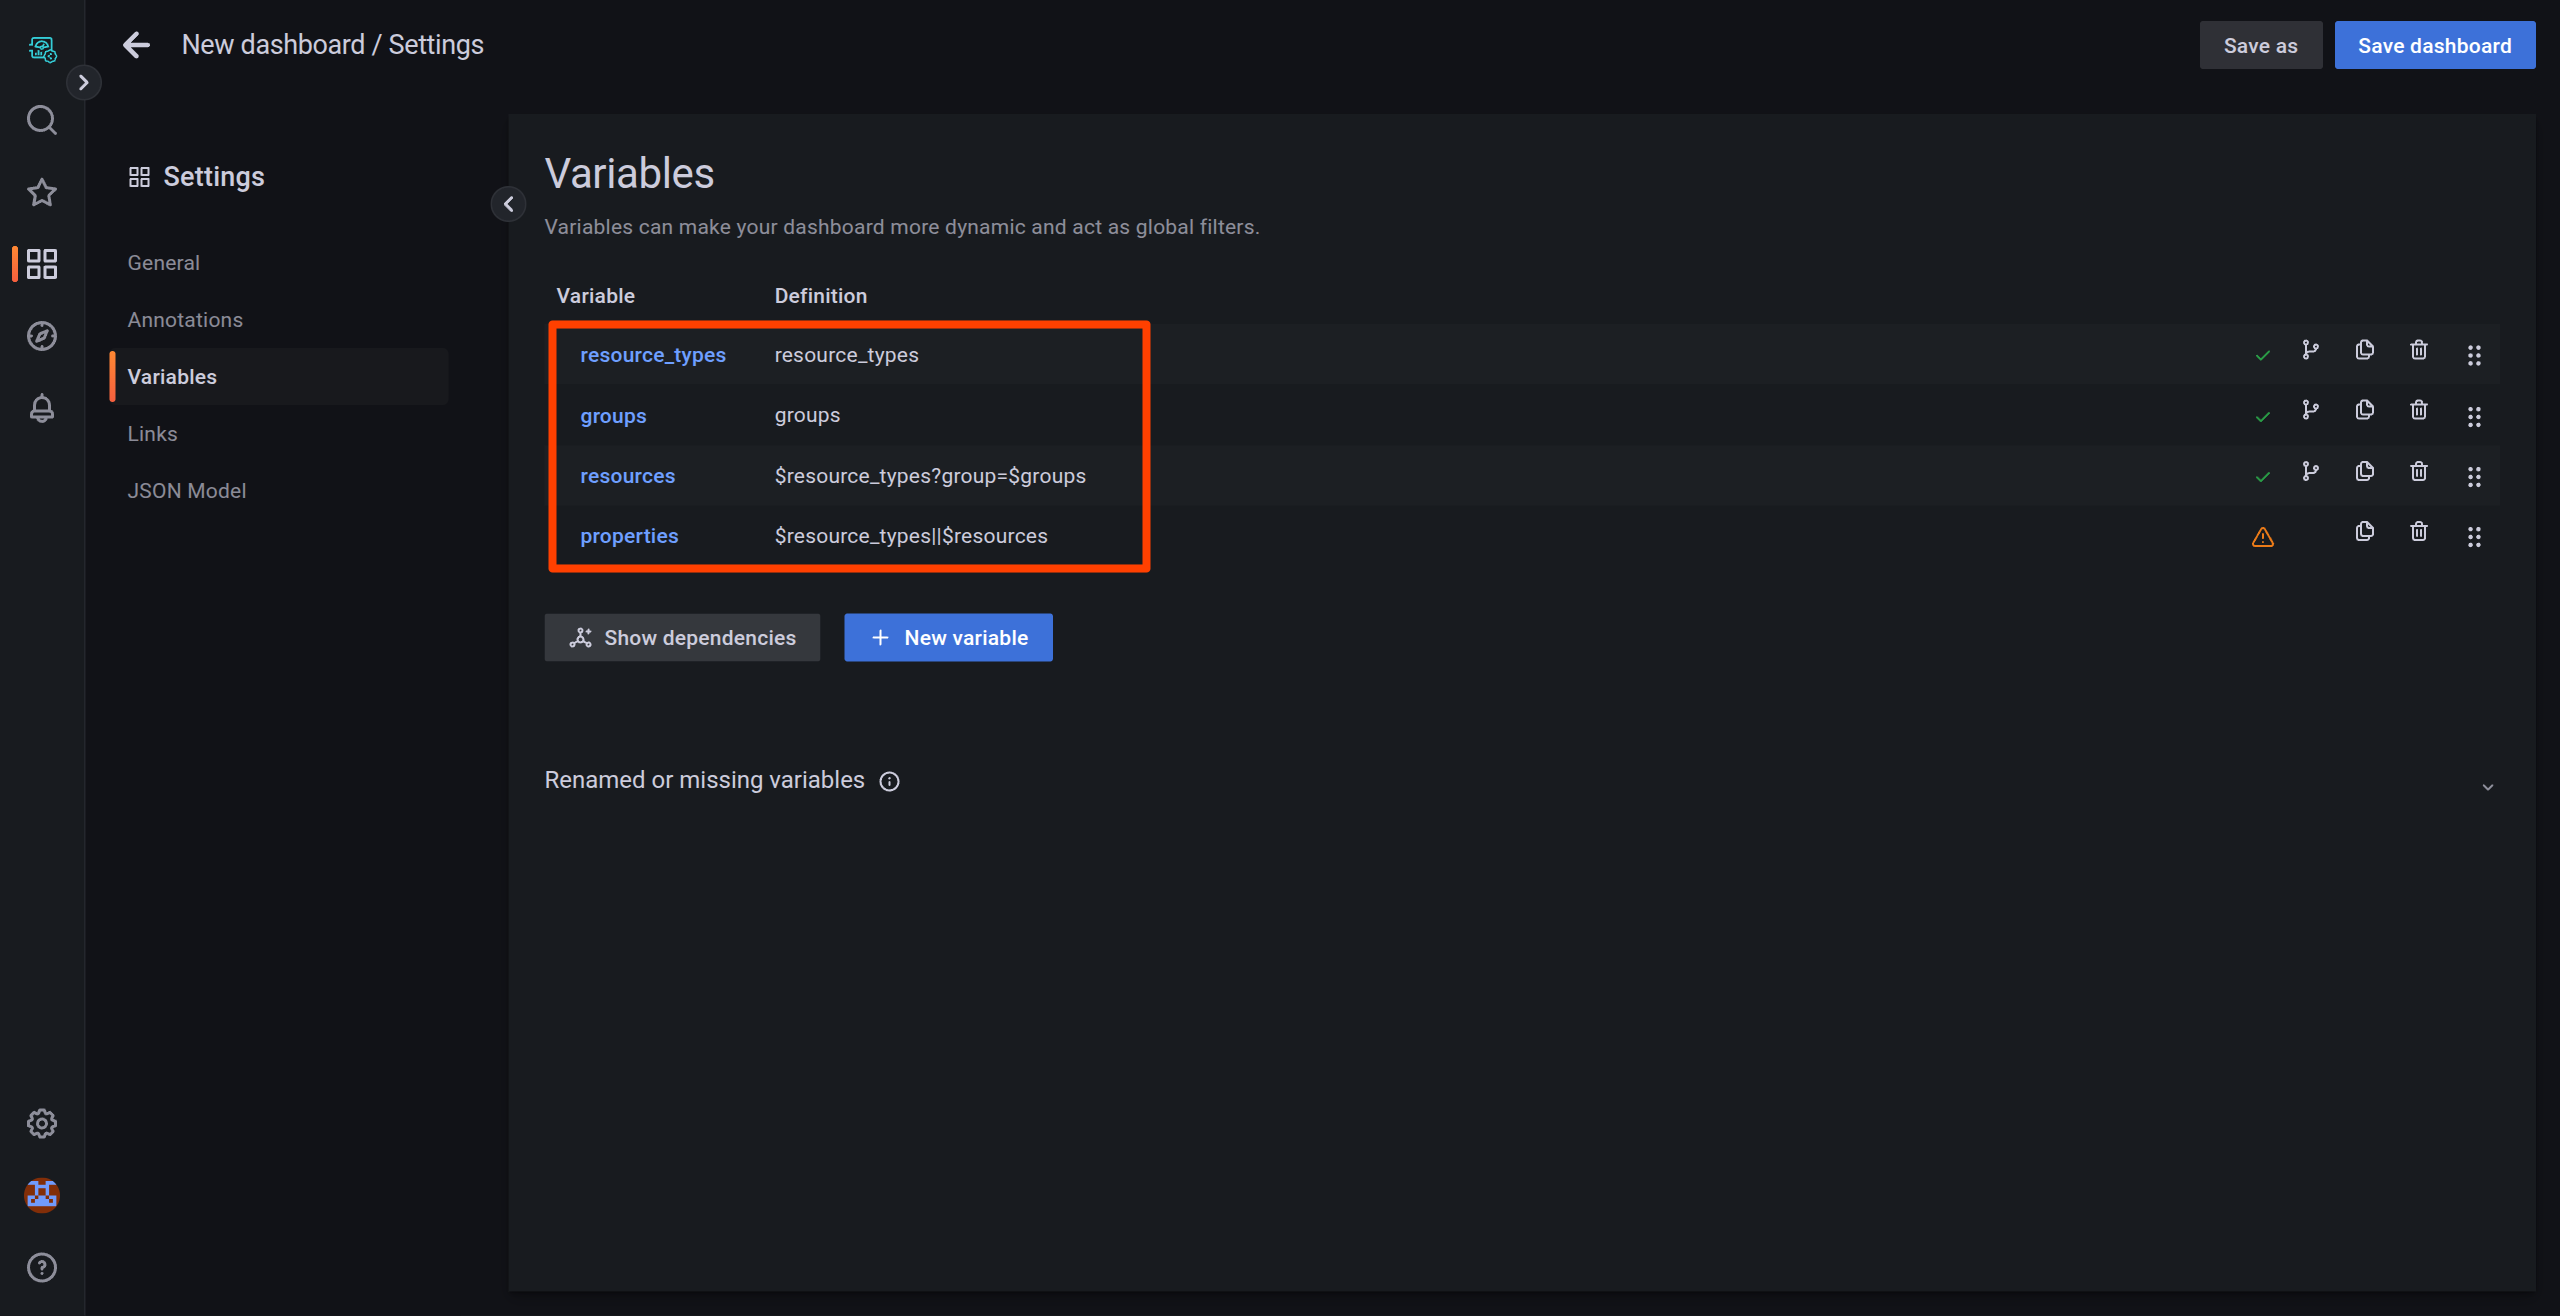
- For example,
- Resource types - by using the query
- Regex: Use regular expressions to specify or extract target resources for the variable. For example:
- To filter SIMs with IMSIs starting with
99999, enter/^99999/. - To filter resources with names starting with
Device-, entername/Device-/.
- To filter SIMs with IMSIs starting with
- Sort: Specify sorting for variable values:
Disabled,Alphabetical (asc/desc),Numerical (asc/desc), orAlphabetical (case-insensitive, asc/desc). - Refresh: Choose when to refresh variable values (
On dashboard loadorOn time range change).
Variable values can be previewed in the Preview of values section.
Custom
With the "Custom" variable type, you can create variables with arbitrary strings.
Custom options
- Values separated by comma: Enter the strings to be used as variable values, separated by commas (
,). For example,Device-1,Device-2,Device-3,Device-4,Device-5.
Preview variable values in the Preview of values section.
Text Box
With the "Text box" variable type, you can input variable values directly at the top of the dashboard.
Text options
- Default value: Specify a default value if applicable.
Query Settings
In the panel editor, you can configure queries to use variables. To learn more, refer to Using Query to Display Data on the Panel.
Panel Settings
In the panel editor, you can configure Soracom Lagoon to dynamically add panels to a dashboard based on variable values. Variables dynamically change queries across all panels in a dashboard. To configure repeating panels:
- Open the dashboard containing the panel you want to edit.
- Click the panel title and select Edit.
- In the display options pane, click Panel options > Repeat options.
- Select a
direction:- Choose
horizontalto arrange panels side-by-side. Soracom Lagoon adjusts the width of repeated panels. You cannot mix other panels in the same row with a repeated panel. - Choose
verticalto arrange panels in a column. Repeated panels will have the same width as the original panel.
- Choose
- Reload the dashboard to propagate changes to all panels.
You can also use variables in the panel title or description by setting the Title or Description fields.
If you set variables for Resources in the query but do not configure the Repeat options in the panel options, you can display multiple resources within a single panel using variables. However, the number of resources that can be displayed simultaneously in a panel using variables is limited to 5.
Row Settings
Soracom Lagoon supports dynamically adding rows to a dashboard based on variable values. To configure repeating rows:
- Open the dashboard containing the panel you want to edit.
- In the Add a panel dialog box, click Add a new row.
- Hover over the row title and click the cog icon.
- In the Row Options dialog box, set a title for the row and select the variable for which you want to add repeating rows.
- Save your changes.
Example Usage
In this example, you will create repeated panels and rows using variables in Soracom Lagoon. The Demo sample data has the following structure:
- Resource Type:
demo - Resources:
Device-1,Device-2,Device-3,Device-4,Device-5 - Properties: Each resource contains
temperatureandhumidity.
Create a New Dashboard
- Sign in to the Soracom Lagoon console.
- From the sidebar, click the Dashboard icon.
- Click the New dropdown button.
- Select New Dashboard.
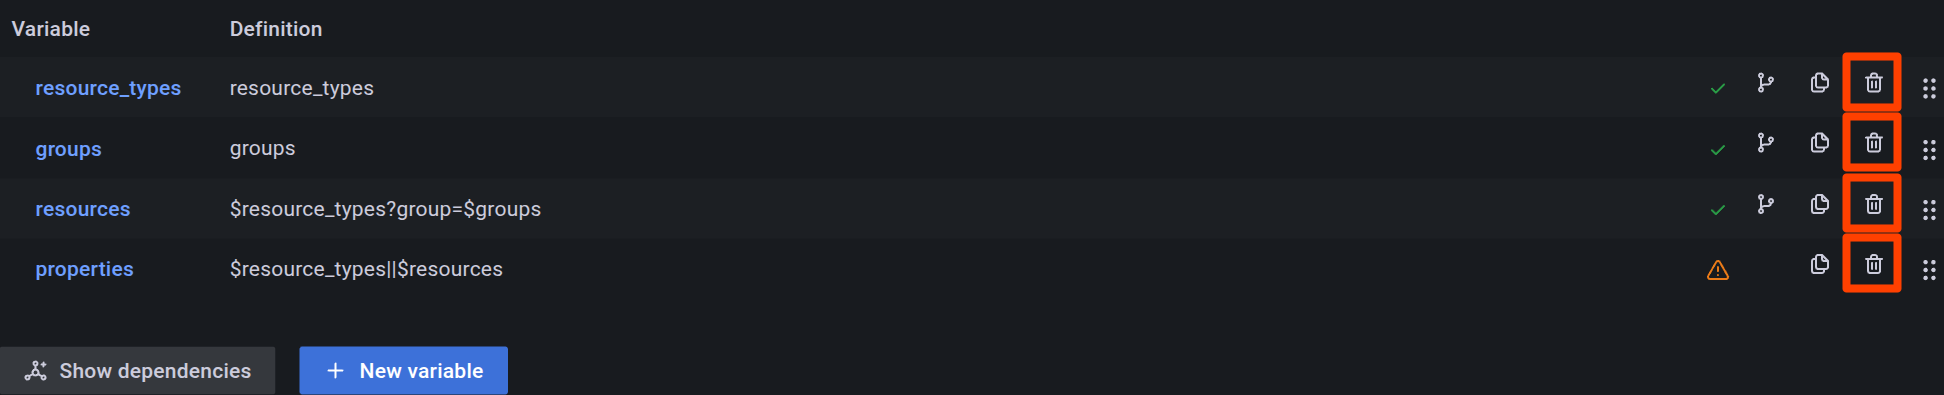
Delete the Built-In Variables
In order to practice configuring the variables, we will first delete the built-in variables.
- Navigate to Dashboard settings > Variables and click the Delete icon next to each of the following variables:
$resource_types$groups$resources$properties
Create a Query Variable for Devices
- Navigate to Dashboard settings > Variables and click Add variable.
- Select Query as the variable type.
- Configure the following options:
- Name:
devices - Data source:
Harvest - Query:
demo - Regex:
name/Device-/
- Name:
- Check the Multi-value option.
- Click Apply.
Create a Custom Variable for Properties
- Navigate to Dashboard settings > Variables and click Add variable.
- Select Query as the variable type.
- Configure the following options:
- Name:
properties - Data source:
Harvest - Query:
demo||$devices - Regex:
name/humidity|temperature|-All-/
- Name:
- Check the Multi-value option.
- Click Apply.
Configure Queries Using Variables
- If you are on the Variables page, click "←" (Go back) or press the
Esckey to return to the Dashboard editor. - Click Add panel and select Add a new panel.
- In the Query tab, set the following:
- For Resource Type, select
Demo. - For Group, select
All Groups. - For Resources, select
$devices. - For Property, select
$properties.
- For Resource Type, select
Enable Repeated Panels
- In the panel editor, navigate to Panel options > Repeat options.
- Configure the following options:
- Title: Set to
$devices $properties. - Repeat by variable: Select
properties. - Repeat direction: Choose
Horizontal.
- Title: Set to
- Click Apply to save the panel settings.
Create a Repeated Row for Devices
- Add a new row to the dashboard by clicking Add panel and selecting Add a new row.
- Hover over the row title and click the cog icon to open Row options.
- Configure the following options:
- Title: Set to
$devices. - Repeat for: Select
devices.
- Title: Set to
- Click Update to apply the settings.
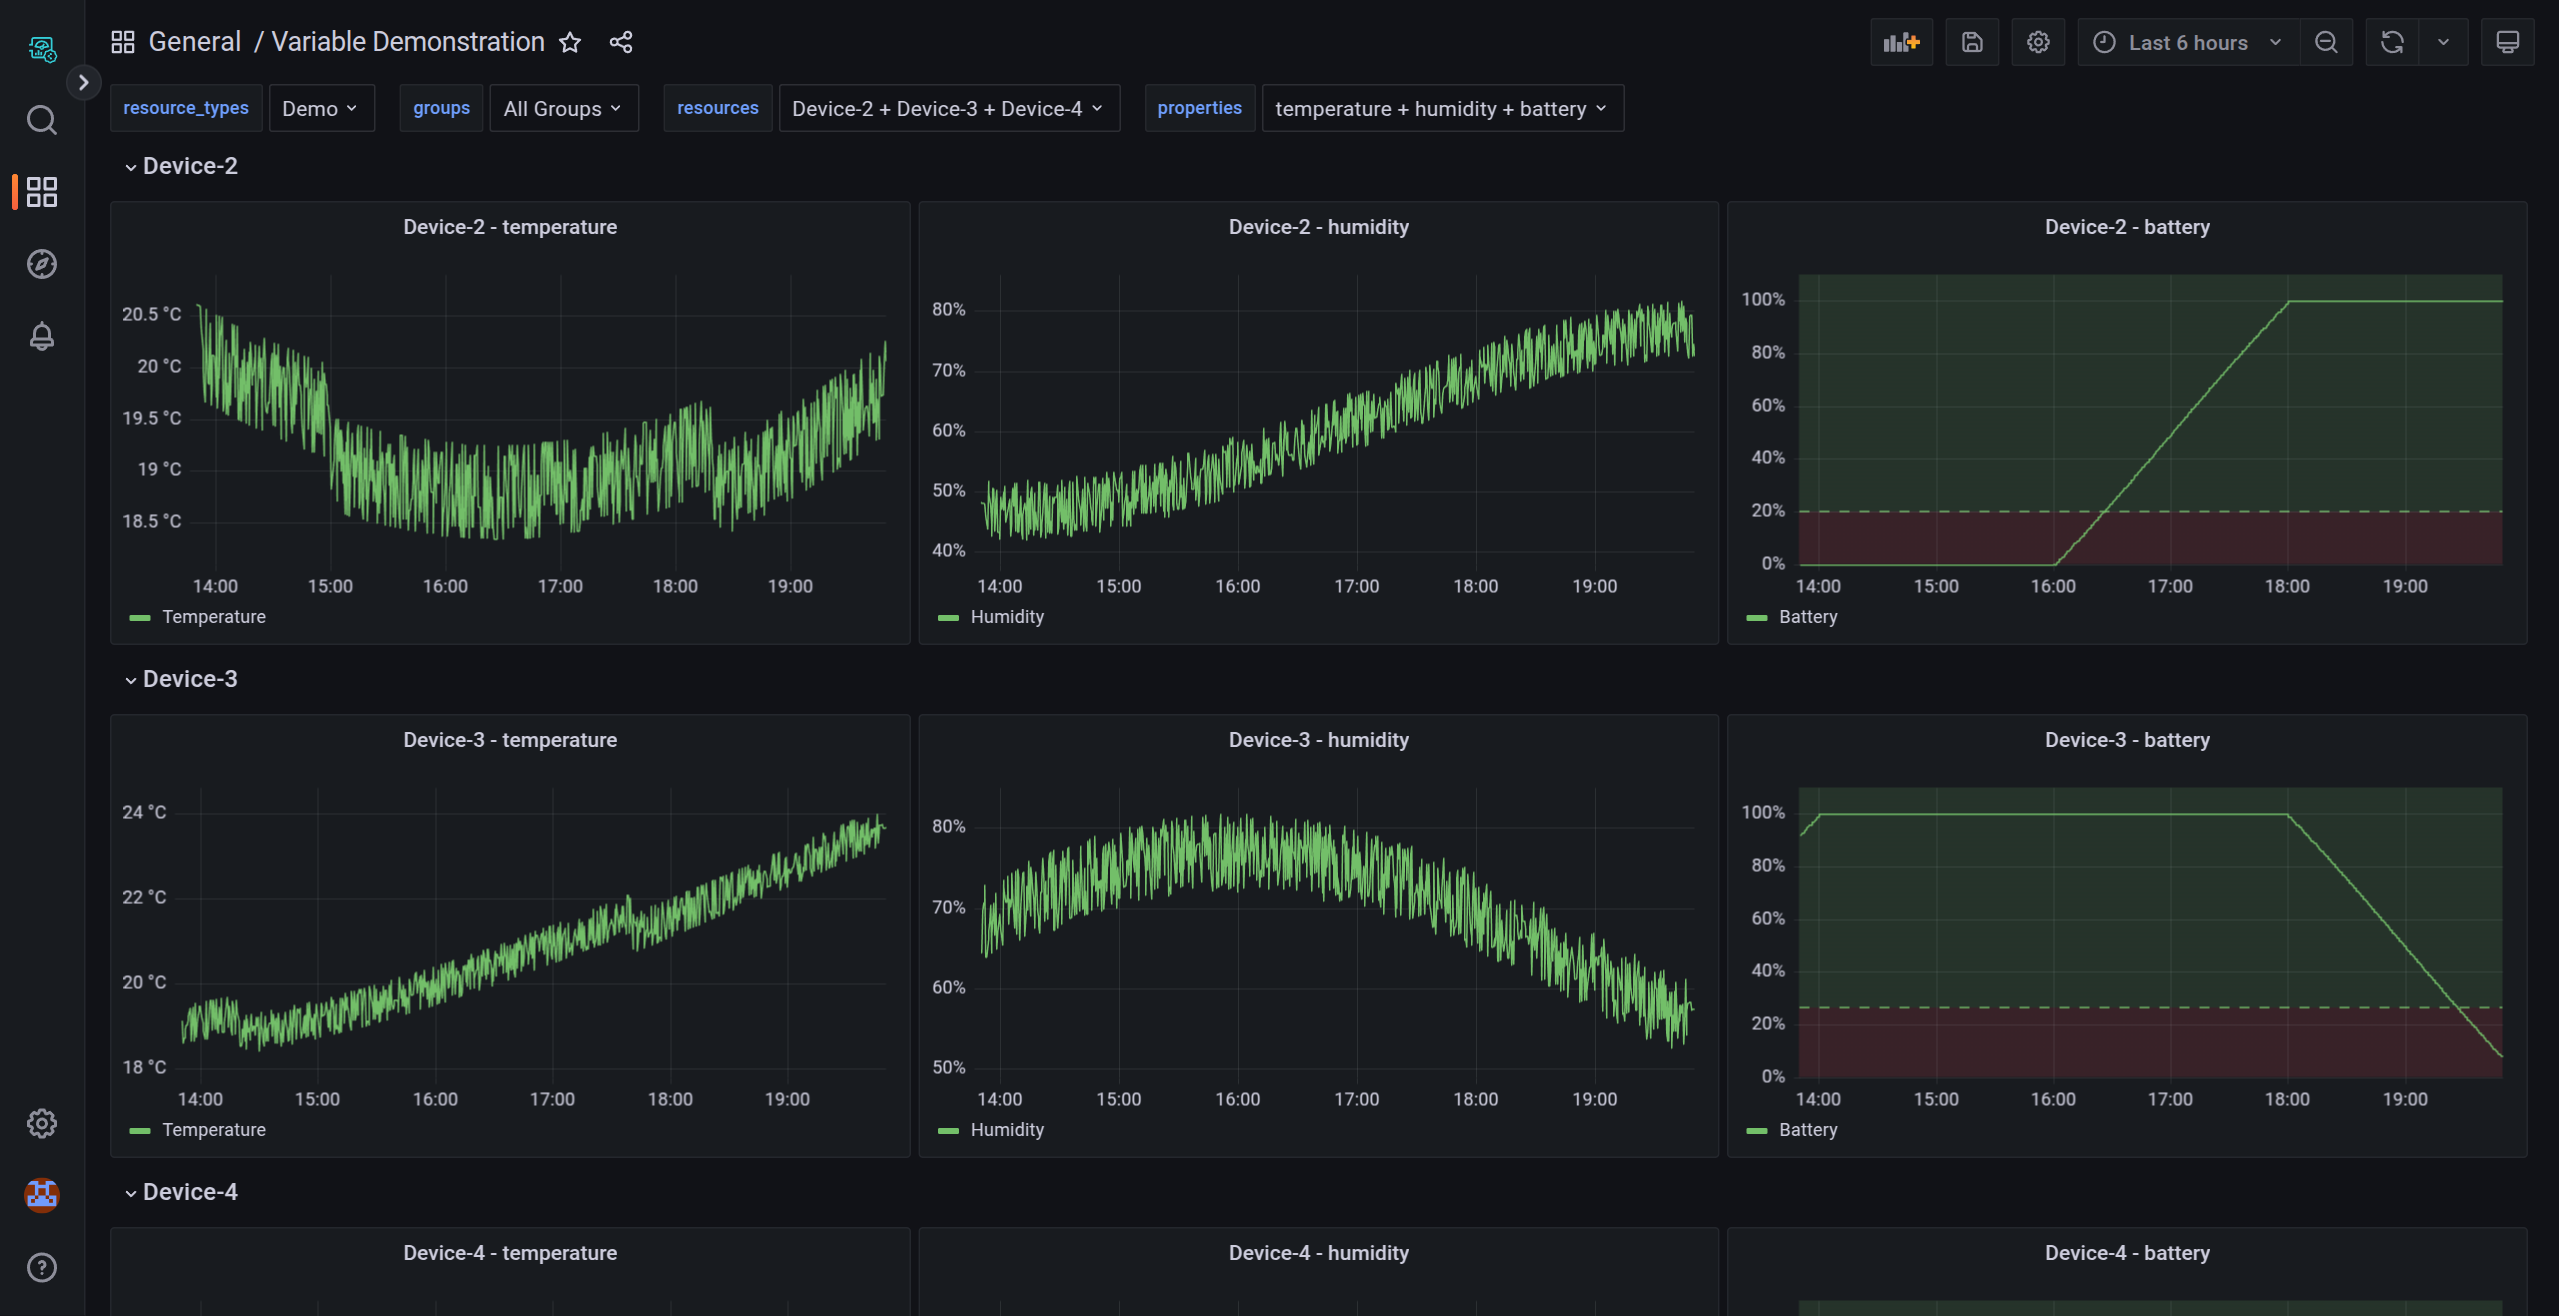
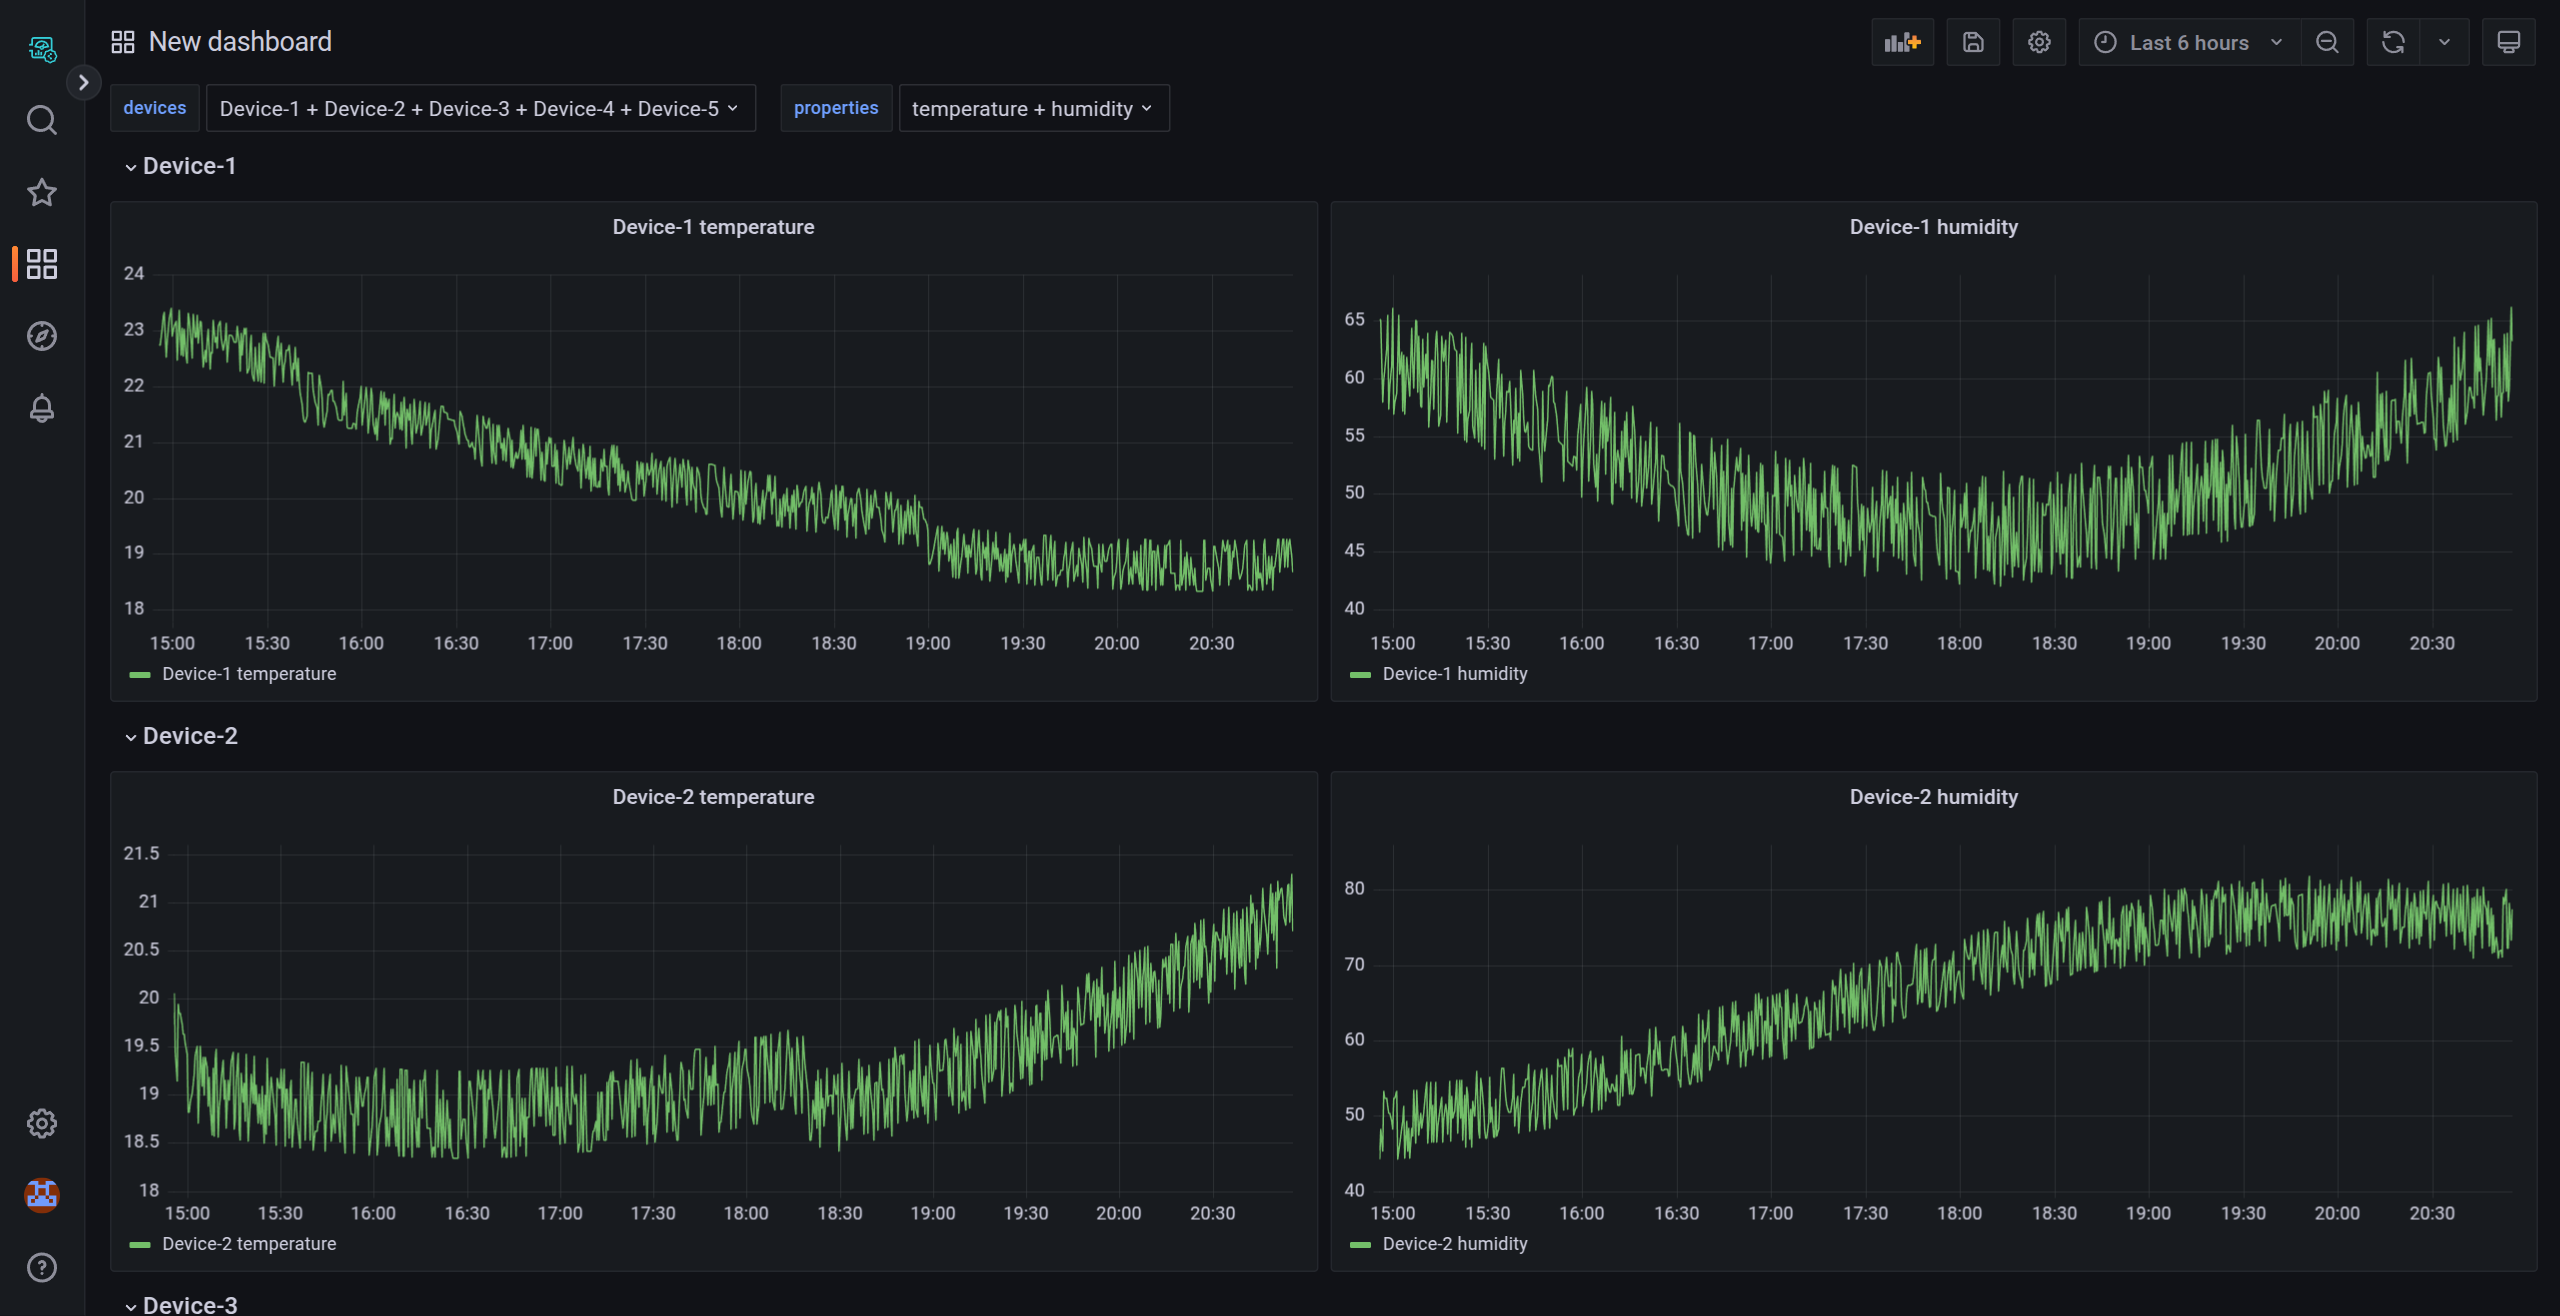
See the Result
After completing these steps, the dashboard will dynamically create:
- Repeated panels for each metric (
temperatureandhumidity) within each row. - Repeated rows for each device (
Device-1,Device-2,Device-3,Device-4, andDevice-5).
You can control your dashboard by selecting values in the devices and properties variables.
This setup ensures a flexible and scalable visualization of your data with minimal manual configuration.