Usage Dashboard
Overview
The Usage Dashboard (labeled Data Usage Analytics on screen) lets you explore and visualize your account's data usage across groups, SIMs, and countries without writing any SQL. It uses Soracom Query as its engine to query the large usage datasets associated with your account, downloads the results into your browser, and then runs all filtering, aggregation, and charting locally with in-browser querying. Although this feature is powered by Soracom Query, the Usage Dashboard is free to use as part of your use of the Soracom platform, and using it incurs no separate Soracom Query charges.
Because analysis happens in the browser after the initial download, you can change filters and drill into individual groups or SIMs interactively — without re-querying the server each time.
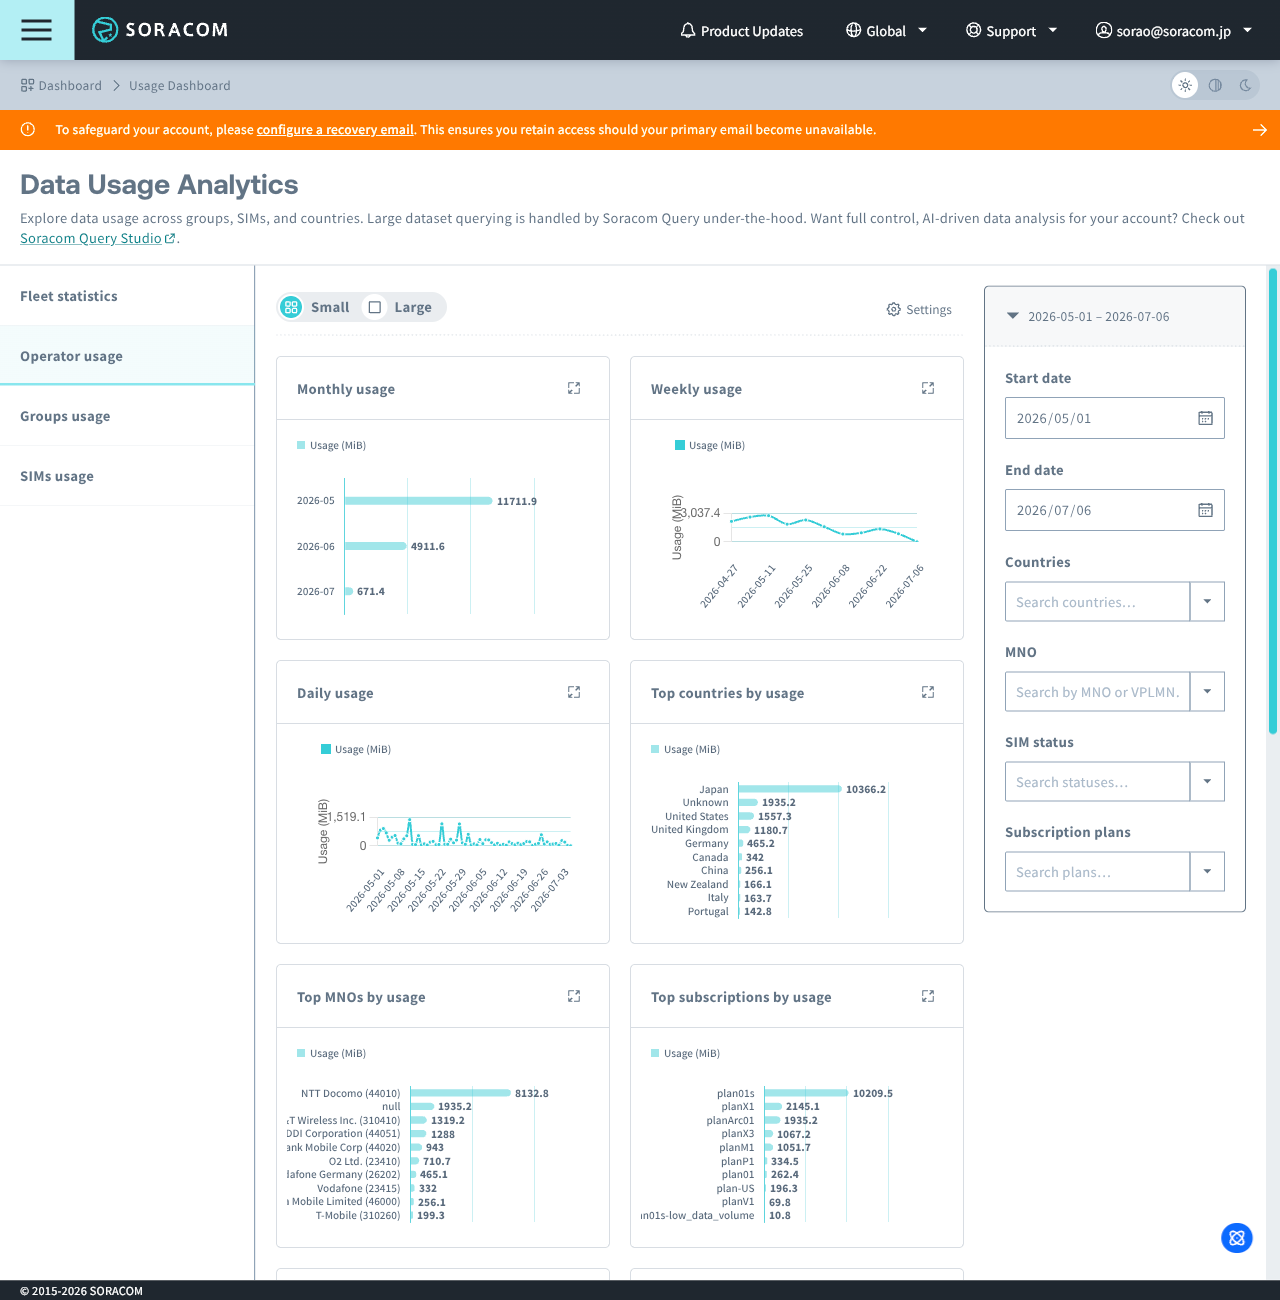
About data freshness: The data the Usage Dashboard retrieves and displays is refreshed only about once every 24 hours, so what you see may differ from real-time usage statistics.
With the Usage Dashboard you can:
- Review your daily data usage broken down to the group or SIM level.
- See fleet-wide statistics, such as the number of SIMs per group and the number of subscribers per plan.
- Compare usage across operators, groups, and individual SIMs using interactive charts and tables.
- Filter your data by time range, MNO, country, SIM status, and subscription plan.
- Export any table to CSV for reporting or further analysis.
For full control and AI-driven analysis of your account data, see Soracom Query Studio. The Usage Dashboard is a purpose-built view for data usage, powered by the same engine.
Accessing the Usage Dashboard
-
Sign in to the User Console. From the Menu, expand Logs & Statistics and select Usage Dashboard.
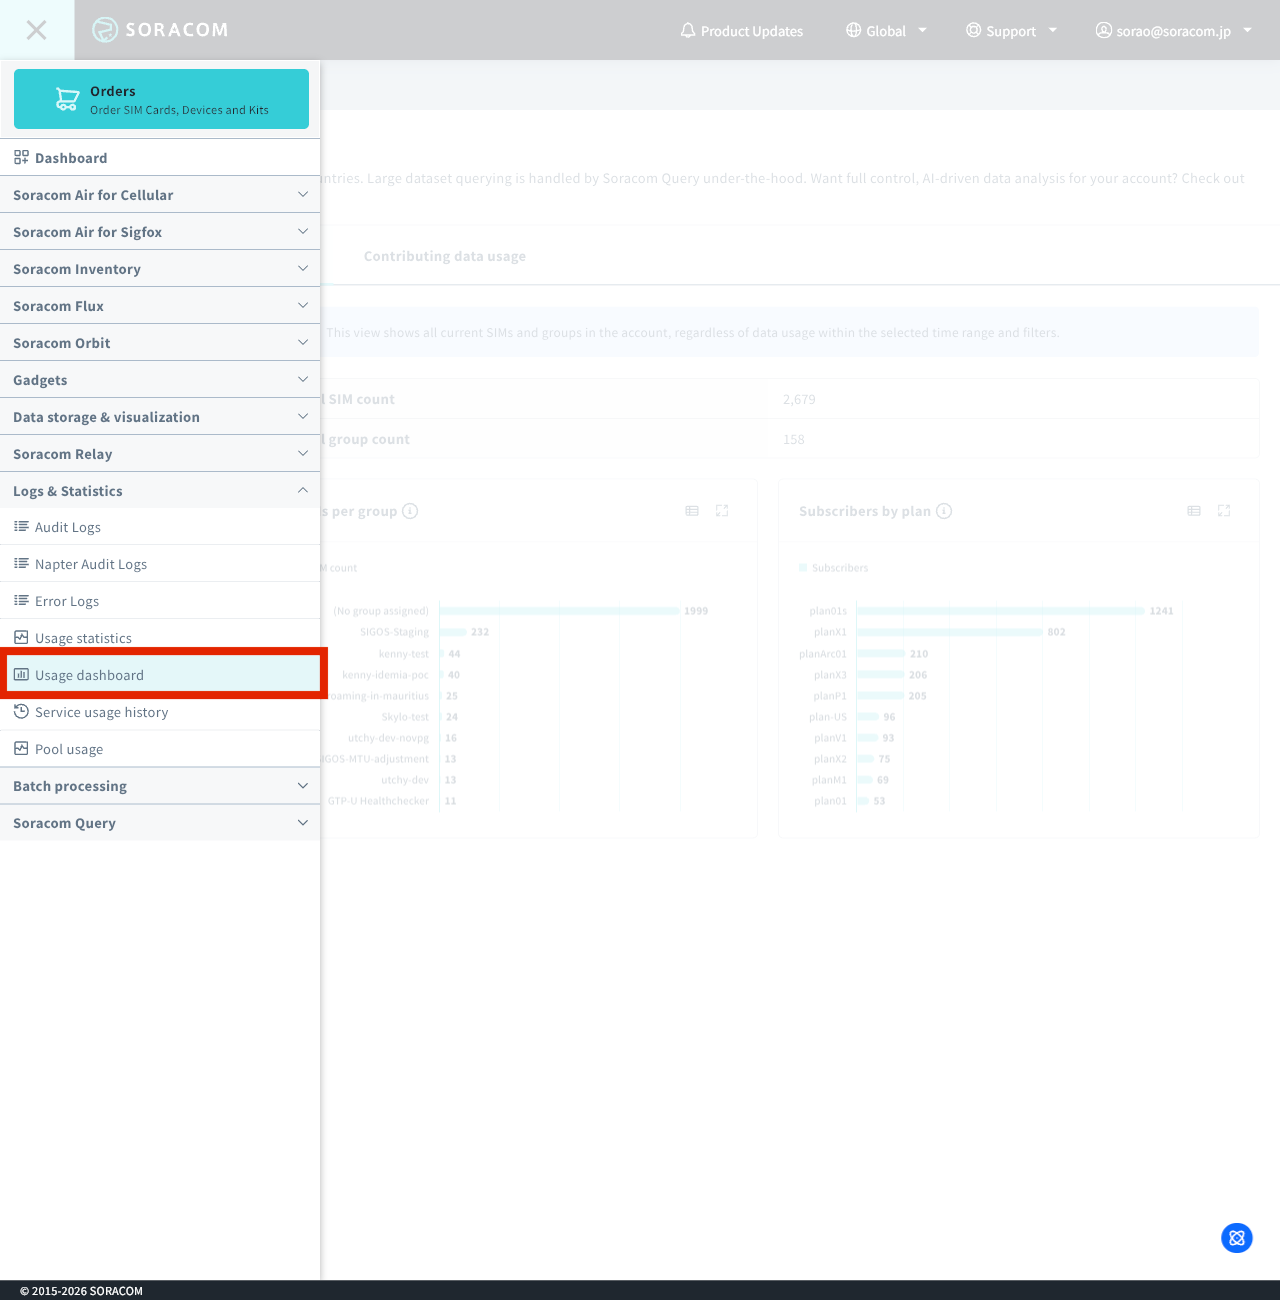
You can also open it directly at
/usage-dashboard. - The start screen for Data Usage Analytics is displayed. From here you can start with the default settings or adjust the pre-download options before fetching your data. See Setup below.
Setup
When you open the Usage Dashboard, you are taken to a start screen titled Data Usage Analytics ("Fetch and analyze your SIM usage data, powered by Soracom Query."). The screen shows a summary of the Selected dashboard type and Selected date range that will be used. From here you can:
- Click Continue to fetch your data using the current settings, or
- Click Settings to adjust the pre-download options first, then click Done to return to the start screen.
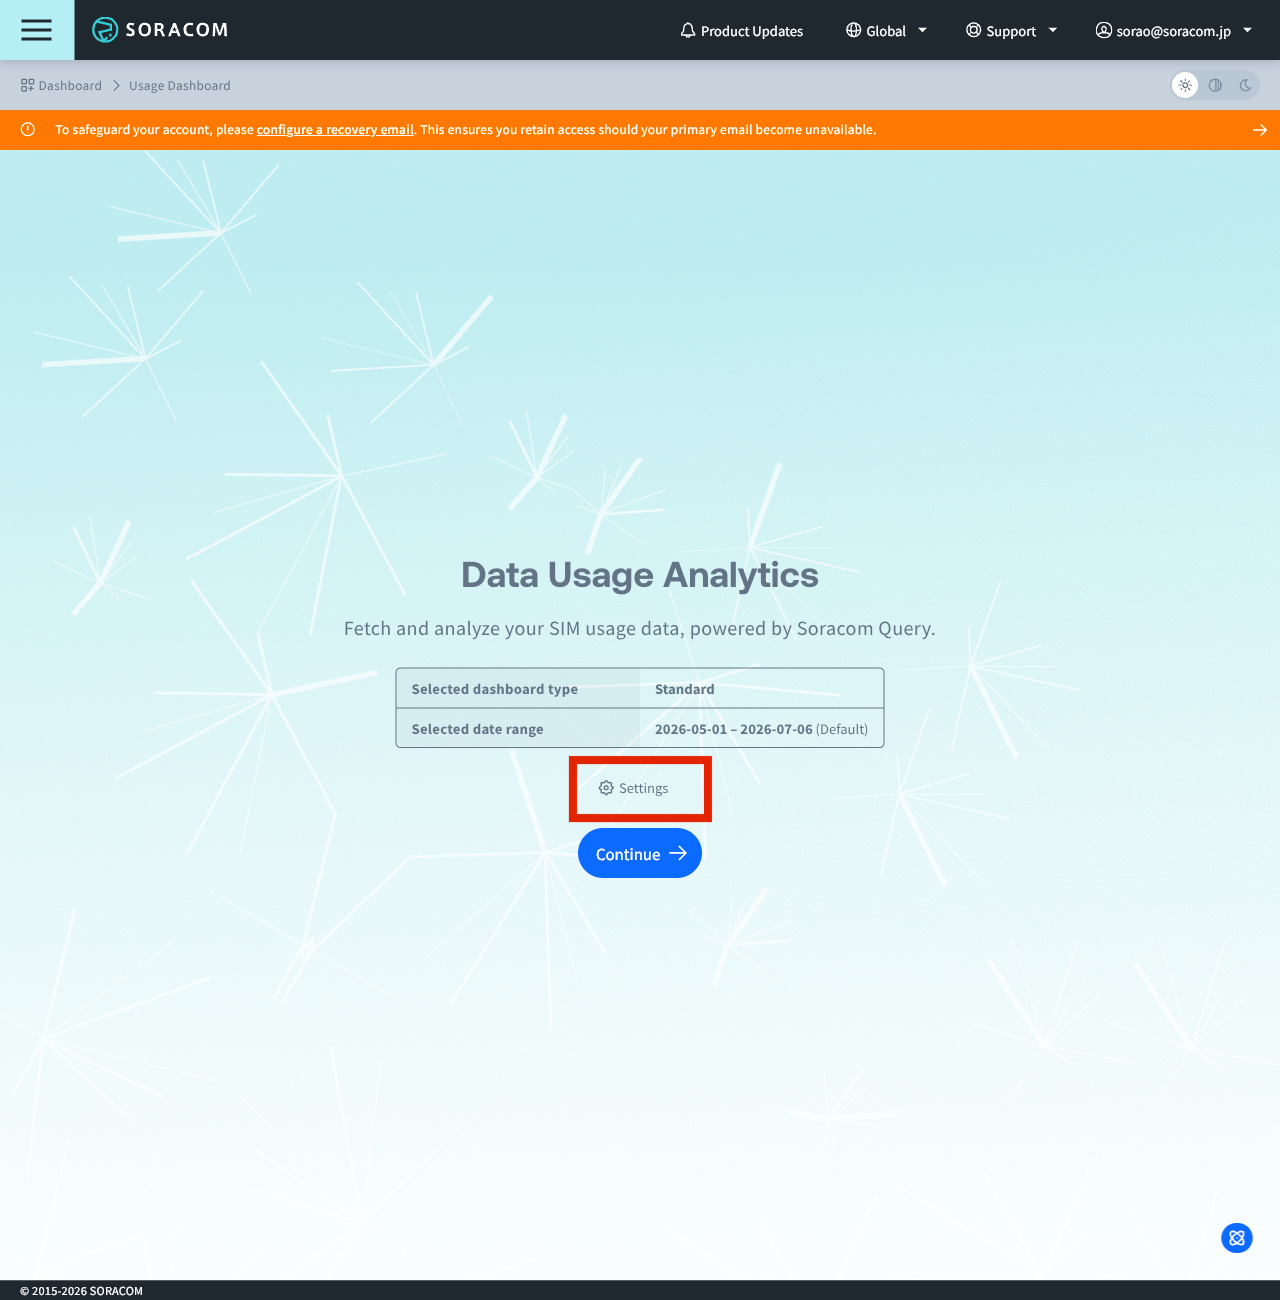
The Settings dialog contains the options described below.
Dashboard Type
Under Dashboard type, choose how granular your usage data is and how much data is downloaded to your browser.
| Option | Breakdown level | Description |
|---|---|---|
| Standard | SIM level | Downloads and analyzes all usage data broken down by the SIM, country, and day of usage. Choose this when you need SIM-level statistics. For large operators (more than 100,000 SIMs), the dataset generated by this query may require a very large download size. |
| Data saver | Group level | Downloads and analyzes all usage data broken down by your account groups, country, and day of usage. Recommended for users who do not need SIM-level statistics and want to avoid heavier download sizes. |
In Data saver mode, the SIMs usage section is not available because SIM-level data is not downloaded. See Viewing your usage data for the sections shown in each mode.
Date Range to Download
Under Date range to download, choose how much data the dashboard queries when it fetches your data.
- Default - Downloads usage data for the current month to date and the previous two months.
- Custom range - Pick a narrower date range to download using the Start date and End date fields. This downloads less data and speeds up loading for large accounts. The dashboard's date filter is then limited to the range you pick.
For large accounts, choosing a Custom range (or using Data saver mode) can significantly reduce how long the initial download takes. You can narrow the range further after the data is loaded, but you cannot widen it beyond what you downloaded without fetching again.
Local Storage
Under Local storage, the Keep results for 24 hours checkbox stores the downloaded data in your browser for 24 hours, so that refreshing the browser session or revisiting this page reuses it instead of downloading again. Use this option if you want to avoid re-downloading the same data multiple times per day.
Because usage data is updated roughly once every 24 hours, stored results are kept for 24 hours only, after which the data is re-fetched so that your analysis reflects the latest available usage.
Viewing Your Usage Data
After you click Continue, the dashboard queries and downloads your usage data, showing its progress (Querying and preparing datasets, then Downloading datasets).
Depending on the number of SIMs in your account and the date range you selected, this can take anywhere from a few seconds to several minutes, just as it does in Soracom Query. If downloads take a long time for your account, consider using Data saver mode or a shorter date range, as described in Setup.
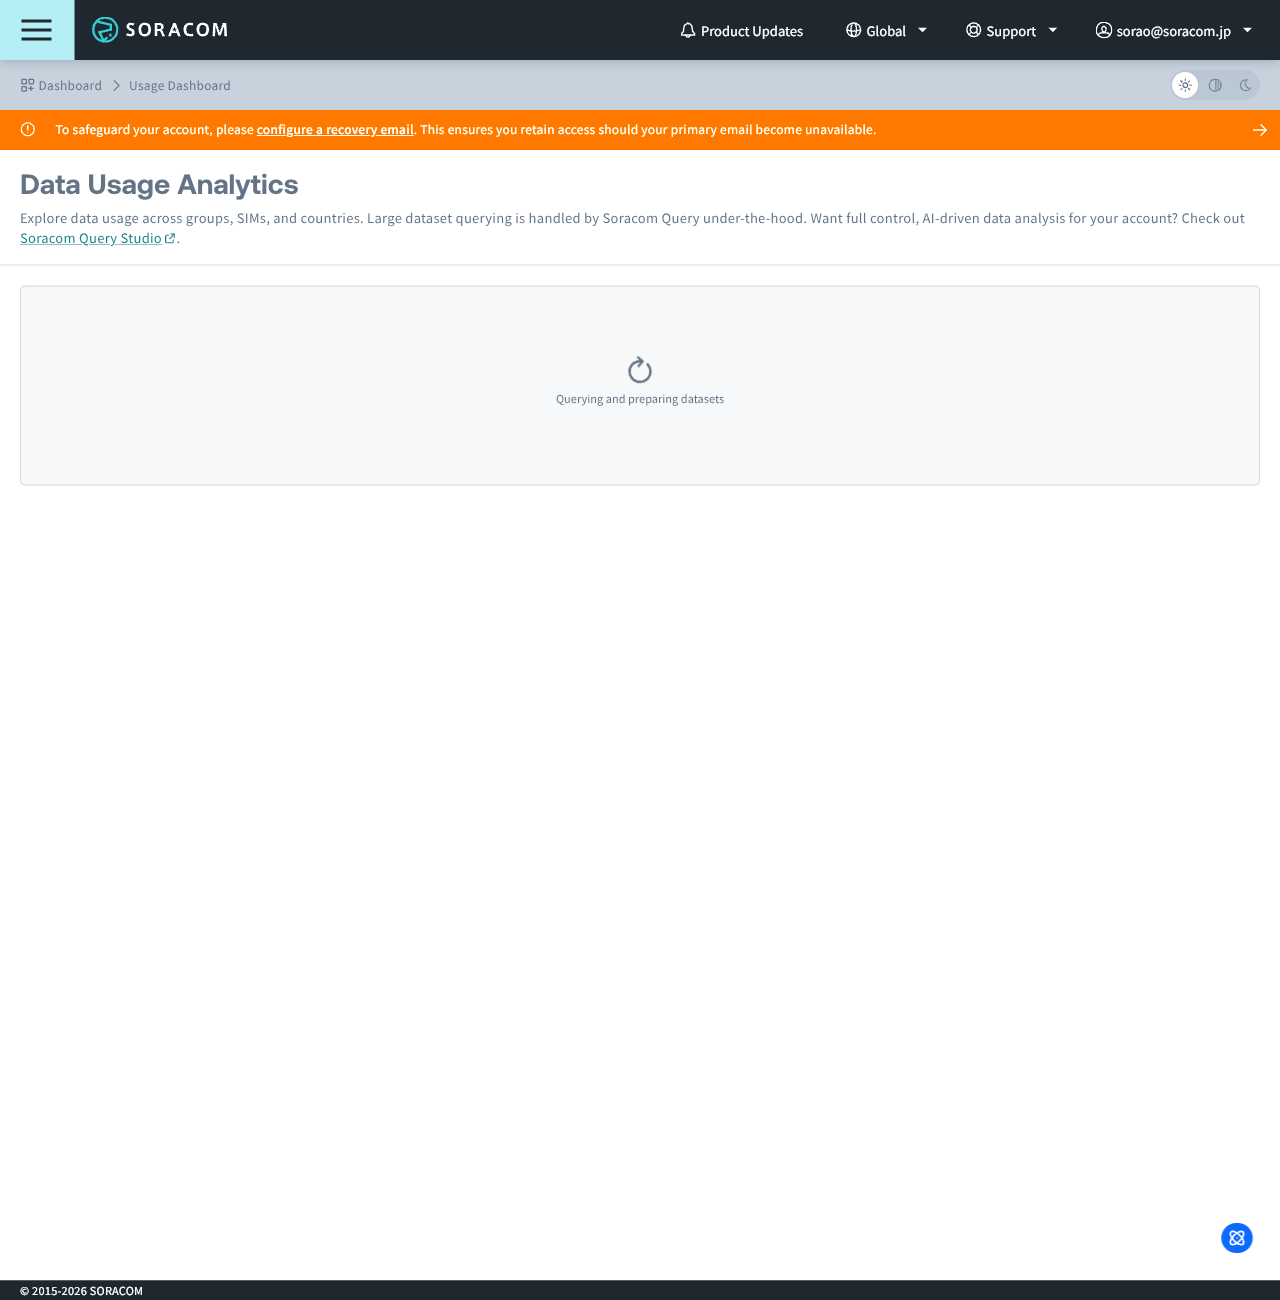
If the datasets are large, a Large download dialog appears showing the total download size and asking whether you want to continue. Click Download anyway to proceed, or Cancel. If you cancel, you can still click Load anyway afterward. Seeing this often is a sign that Data saver mode or a shorter date range would help.
Once the download completes, you will see three or four sections as tabs, depending on the mode you selected:
| Section | Standard mode | Data saver mode |
|---|---|---|
| Fleet statistics | ✅ | ✅ |
| Operator usage | ✅ | ✅ |
| Groups usage | ✅ | ✅ |
| SIMs usage | ✅ | ❌ (not available) |
Fleet Statistics
The Fleet statistics section summarizes the makeup of your fleet. It has two tabs:
- All - Shows all current SIMs and groups in the account, regardless of data usage within the selected time range and filters, as of the most recent time the data was fetched. It includes totals such as Total SIM count and Total group count, and charts for SIMs per group and Subscribers by plan.
- Contributing data usage - Shows the same kind of information, but only for the SIMs and groups that actually contributed data usage for the selected filters and date range. It includes Contributing SIM count and Contributing group count, and charts for Contributing SIMs per group and Contributing subscribers by plan.
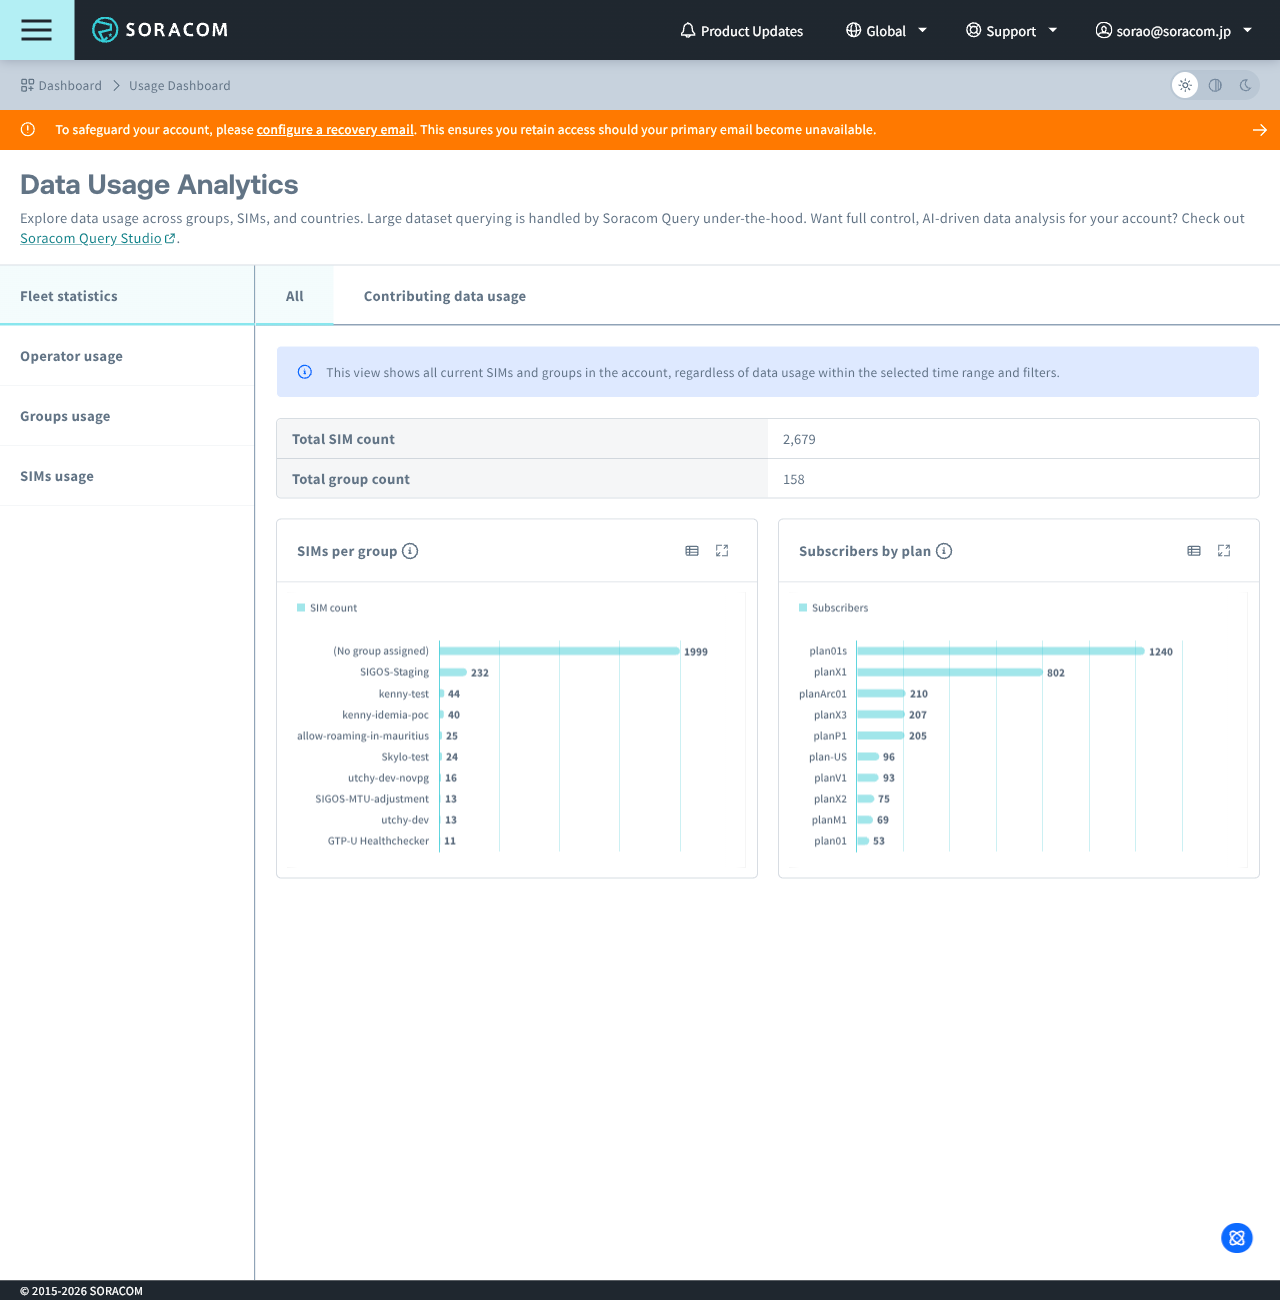
The Contributing data usage tab supports filtering; the All tab always reflects current fleet counts and is not affected by the selected filters or date range.
Operator Usage
The Operator usage section shows data usage charts and tables totaled for your entire account, including monthly, weekly, and daily usage, and Top groups by usage and Top SIMs by usage charts.
The Daily usage table can be grouped By country, By MNO, or By subscription.
Groups Usage
The Groups usage section shows data usage charts and tables at the group level.
The Total usage per Group table lists each group's Contributing SIMs, Total usage, and a breakdown of usage by country, MNO, and subscription. Click a group to open a details modal for that specific group. See Group and SIM details.
SIMs Usage
The SIMs usage section is only available in Standard mode.
The SIMs usage section shows data usage charts and tables at the SIM level.
The Total usage per SIM table lists each SIM's ID, name, group, subscriptions, status, and Total usage, along with a breakdown of usage by country, MNO, and subscription. Click a SIM to open a details modal for that specific SIM. See Group and SIM details.
Filtering
Because analysis runs in your browser, you can refine what you see at any time without re-downloading your data. The Filters panel is available on the Contributing data usage tab of Fleet statistics, as well as on the Operator usage, Groups usage, and SIMs usage sections. Available filters are:
- Date range - Narrow the time range within the range you selected at download time, using the Start date and End date fields.
- MNO - Filter by MNO (mobile network operator) or VPLMN (Visited Public Land Mobile Network).
- Countries - Filter by country.
- SIM status - Filter by SIM status.
- Subscription plans - Filter by subscription plan.
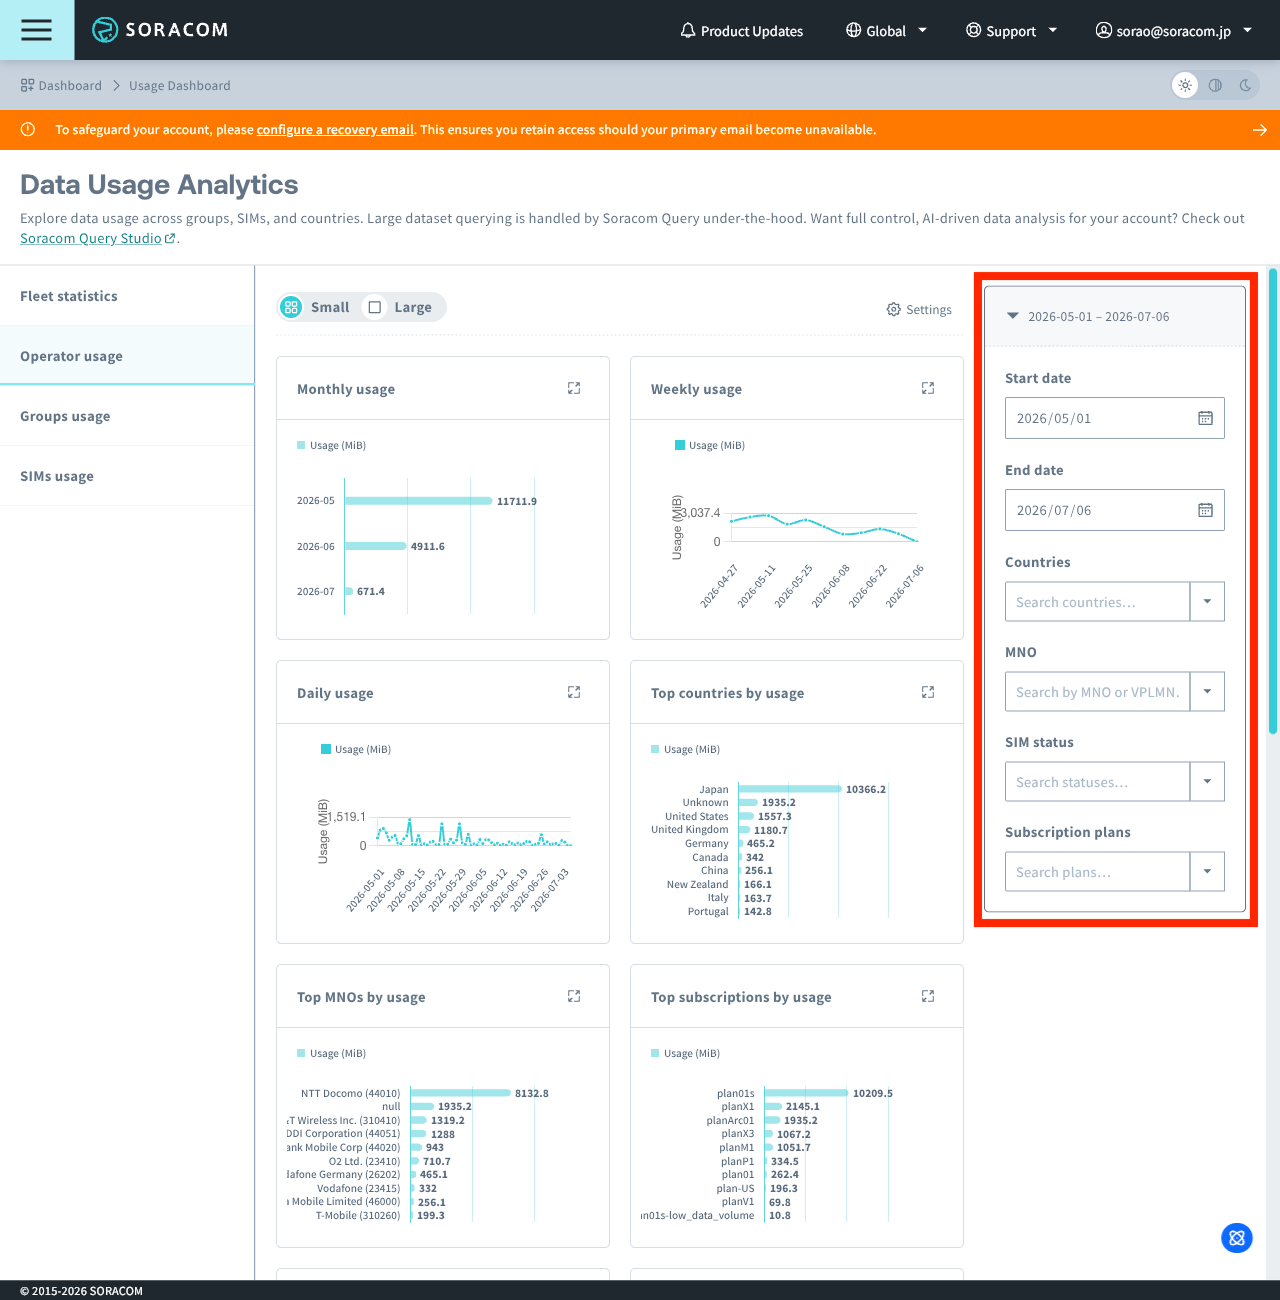
You can narrow the date range, but you cannot extend it beyond what was downloaded. To analyze a wider range, return to Setup and fetch your data again with a longer date range.
Group and SIM Details
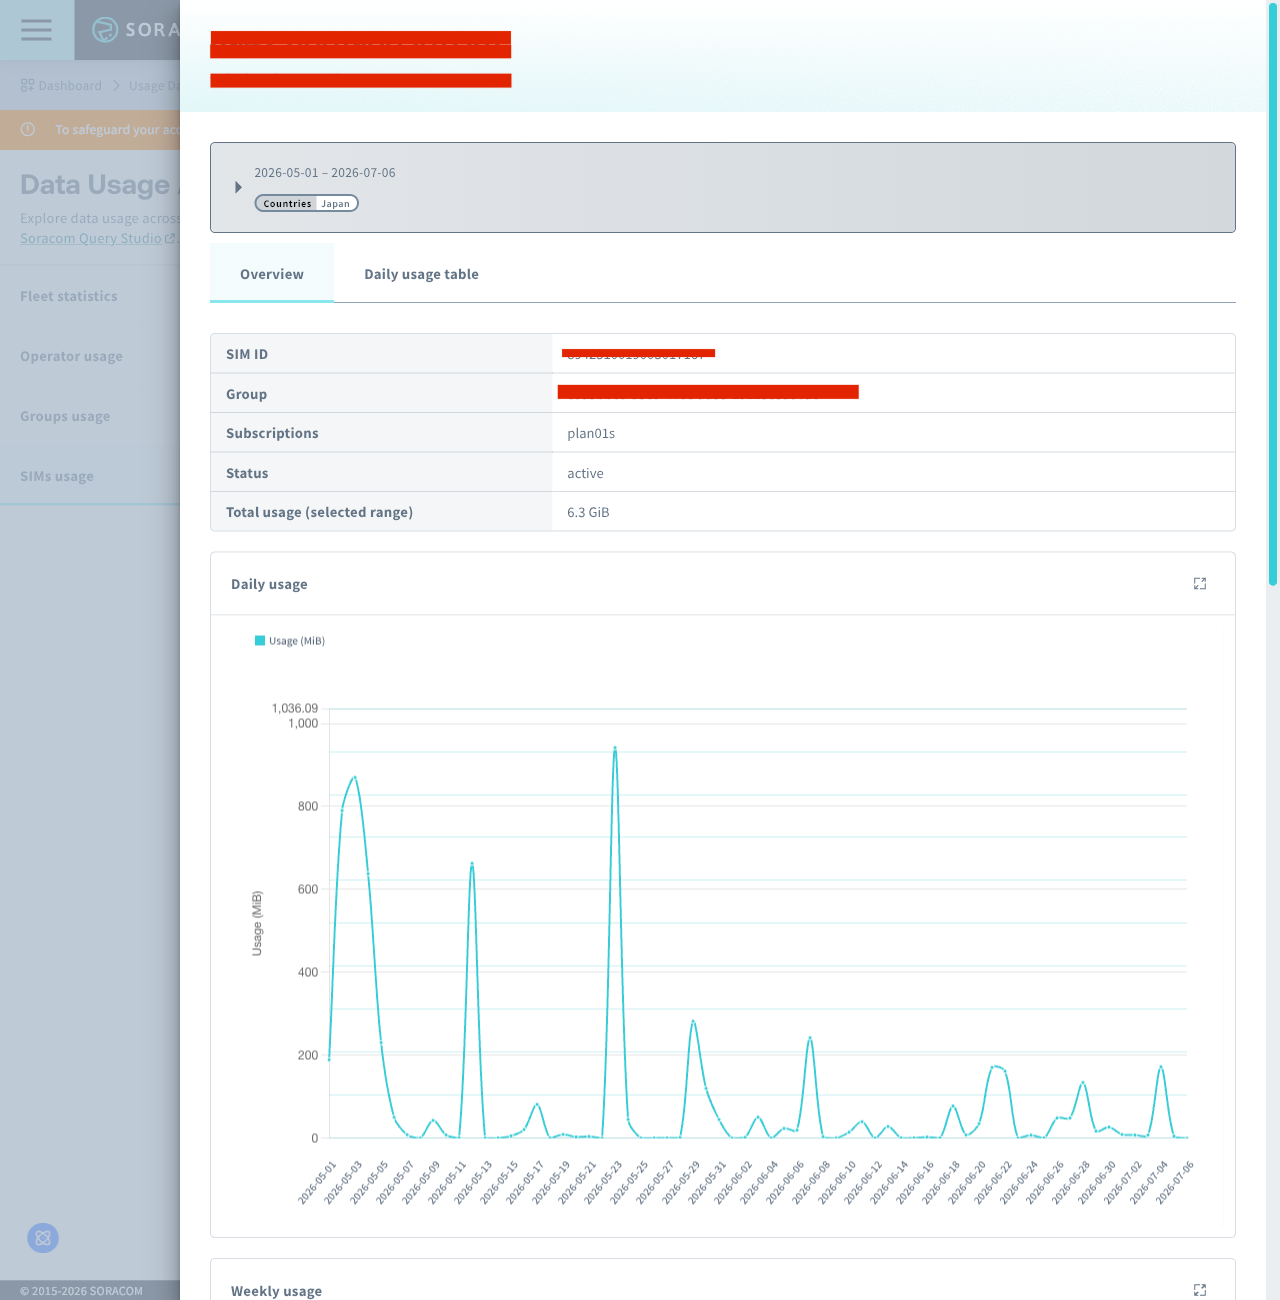
In the Total usage per Group and Total usage per SIM tables, click a group or SIM to open a details modal for that specific group or SIM. The modal shows data usage and charts scoped to your selection, with Overview and Daily usage table tabs (the group modal also has a Total usage by SIM tab).
Within the details view, you can add or modify filters that apply only to that group or SIM, so you can drill into a single group or SIM without affecting the rest of the dashboard.
Additional Features
Exporting Data to CSV
Any table in the dashboard can be exported to CSV. Click Export CSV to download the dataset.
The exported CSV contains only the items that match the filters currently applied to that table.
Charts
- Full-screen view - Each chart has a View full screen button that opens a larger version of the chart in a modal for closer inspection.
- Table view - Some charts have a View as table button (with View as chart to switch back) that displays the chart's data as a table, so you can read more data points. Table view is available on the Fleet statistics charts only.
SAM User Permissions
The Usage Dashboard retrieves its data through the Soracom Query (Analysis) API operations, specifically the /v1/analysis/templates and /v1/analysis/queries APIs. A SAM user needs permission for these operations to view the dashboard.
If a SAM user cannot view the Usage Dashboard, add the Analysis:* permission to the user. Ask your administrator to grant this permission if needed.